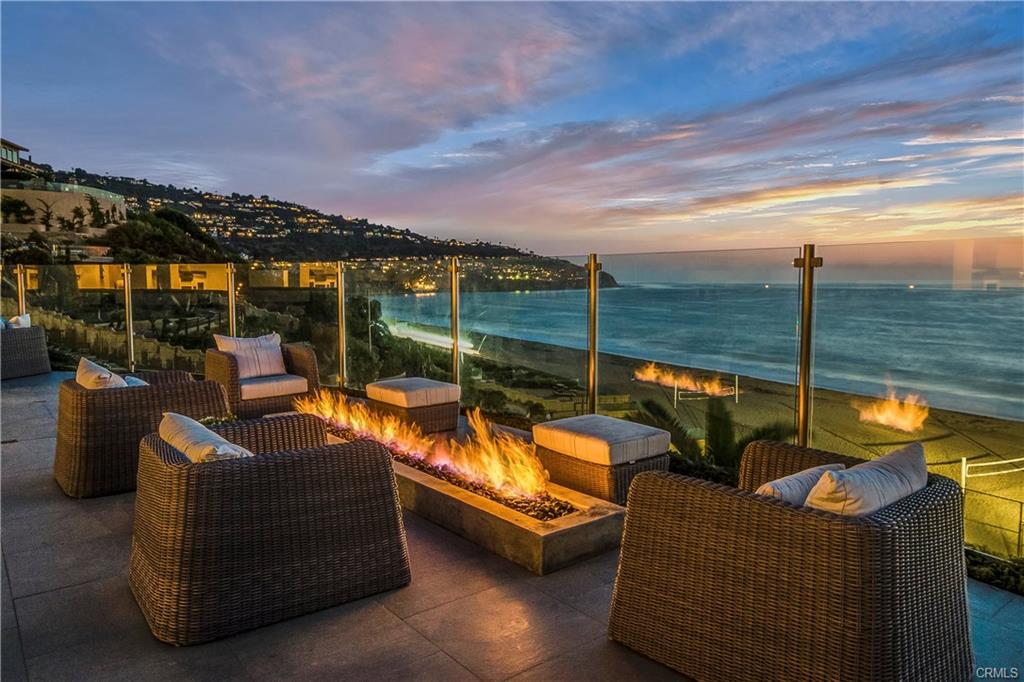
2019 was a very solid year for home sales in Torrance CA. There were 1,201 on market home sales in the city for an average of 100 a month.  The average list price was $818,500 with an average sales prices of $760,333 indicating that the market is still very strong and slightly favors sellers. View the chart further down the page to see how it compares with previous years. Average days on market during the year was 32 so homes tended not to last all that long.
View the current homes for sale in Torrance CA
2019 Home Sales and Home Prices By Month in Torrance
|
Month
|
Jan
|
Feb
|
Mar
|
Apr
|
May
|
Jun
|
Jul
|
Aug
|
Sep
|
Oct
|
Nov
|
Dec
|
2019
|
Avg Per Month
|
|
For Sale
|
131
|
146
|
140
|
150
|
167
|
161
|
151
|
149
|
140
|
122
|
97
|
73
|
1627
|
136
|
|
New Listing
|
113
|
112
|
130
|
131
|
150
|
142
|
126
|
144
|
107
|
118
|
72
|
35
|
1380
|
115
|
|
Sold
|
86
|
50
|
87
|
99
|
123
|
103
|
109
|
120
|
114
|
119
|
90
|
101
|
1201
|
100
|
|
Pended
|
79
|
79
|
109
|
110
|
126
|
120
|
110
|
132
|
101
|
99
|
90
|
57
|
1212
|
101
|
|
Avg. Active Price*
|
$720
|
$780
|
$803
|
$805
|
$851
|
$869
|
825
|
$825
|
$819
|
$900
|
$822
|
803
|
$818,500
|
|
|
Avg. Sold Price*
|
$745
|
$739
|
$758
|
$ 753
|
$751
|
$775
|
$ 762
|
$800
|
$784
|
$734
|
$805
|
$814
|
|
$768,333
|
|
Avg. Sq. Ft. Price (Sold)
|
$499
|
$495
|
$494
|
$473
|
$ 507
|
$510
|
$496
|
$514
|
$496
|
$509
|
$519
|
$513
|
$502
|
|
|
Avg Days on Market
|
41
|
34
|
33
|
37
|
25
|
25
|
30
|
30
|
32
|
31
|
37
|
31
|
32
|
|
|
Median Sold Price
|
$745
|
$718
|
$745
|
$725
|
$ 733
|
$733
|
$ 742
|
$793
|
$777
|
$741
|
$802
|
$780
|
$ 9,034
|
$ 752,833
|

