Torrance Real Estate Market Update
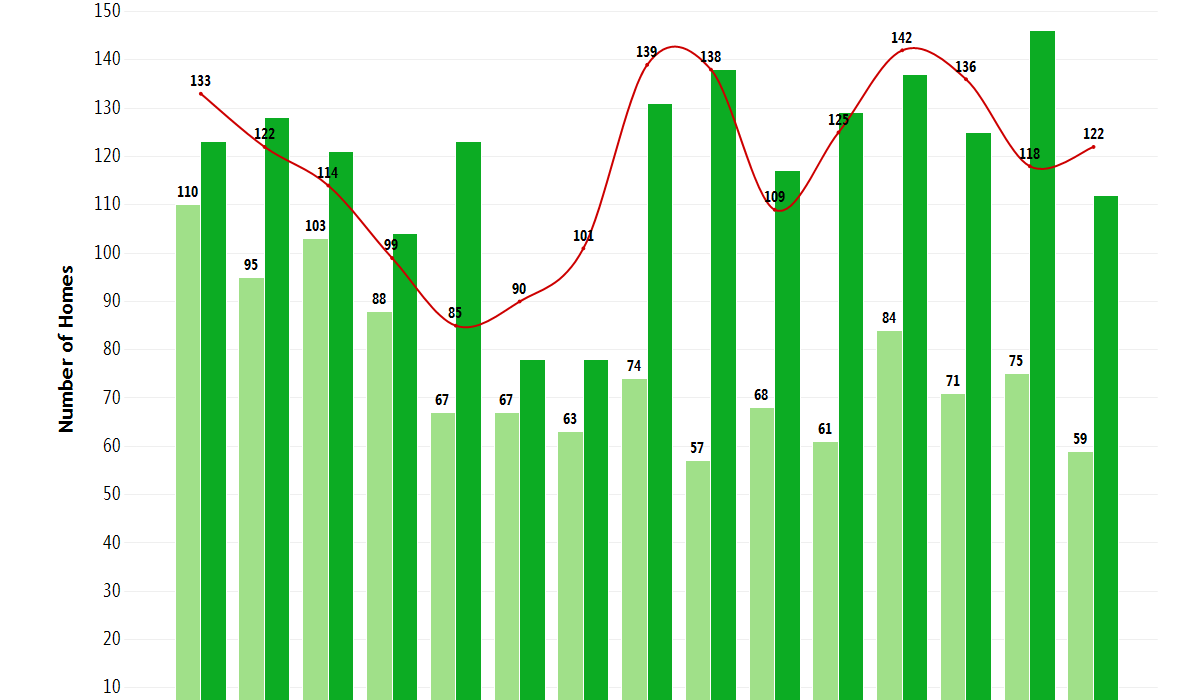
Take a look below at the past 15 months and how each month compares. We’ve seen an increase in new listings, pending sales and closed homes since the beginning of the year. See how this compares with other months on our Torrance real estate trends and statistics page.
| Date | March | April | May | June | July | August | Sept | October | November | Dec | Jan 2022 | Feb 2022 | Mar 2022 |
| For Sale | 74 | 57 | 68 | 61 | 84 | 71 | 75 | 59 | 45 | 30 | 47 | 52 | 76 |
| New Listing | 166 | 127 | 143 | 130 | 174 | 133 | 115 | 111 | 93 | 61 | 110 | 108 | 144 |
| Sold | 131 | 138 | 117 | 129 | 137 | 125 | 146 | 112 | 104 | 111 | 76 | 71 | 106 |
| Pended | 139 | 138 | 109 | 125 | 142 | 136 | 117 | 114 | 103 | 70 | 78 | 94 | 133 |
| Months of Inventory (Closed Sales) | 0.6 | 0.4 | 0.6 | 0.5 | 0.6 | 0.6 | 0.5 | 0.5 | 0.4 | 0.3 | 0.6 | 0.7 | 0.7 |
| Months of Inventory (Pended Sales) | 0.5 | 0.4 | 0.6 | 0.5 | 0.6 | 0.5 | 0.6 | 0.5 | 0.4 | 0.4 | 0.6 | 0.6 | 0.6 |
| Absorption Rate (Closed Sales) % | 177 | 242.1 | 172.1 | 211.5 | 163.1 | 176.1 | 194.7 | 189.8 | 231.1 | 370 | 161.7 | 136.5 | 139.5 |
| Absorption Rate (Pended Sales) % | 187.8 | 242.1 | 160.3 | 204.9 | 169 | 191.5 | 156 | 193.2 | 228.9 | 233.3 | 166 | 180.8 | 175 |
| Avg. Active Price | 845 | 904 | 896 | 930 | 996 | 961 | 843 | 802 | 880 | 854 | 928 | 1018 | 1112 |
| Avg. Sold Price | 922 | 920 | 898 | 942 | 901 | 978 | 969 | 1006 | 941 | 968 | 963 | 968 | 1058 |
| Avg. Sq. Ft. Price (Sold) | 562 | 588 | 611 | 605 | 603 | 643 | 643 | 636 | 627 | 626 | 641 | 700 | 670 |
| Sold/List Diff. % | 102 | 105 | 106 | 106 | 106 | 106 | 105 | 104 | 104 | 104 | 104 | 106 | 106 |
| Sold/Orig LP Diff. % | 102 | 105 | 106 | 106 | 106 | 106 | 105 | 104 | 103 | 104 | 104 | 106 | 106 |
| Avg Days on Market | 23 | 14 | 16 | 13 | 11 | 12 | 14 | 15 | 15 | 15 | 20 | 14 | 10 |
| Median Active Price | 788 | 899 | 799 | 890 | 950 | 859 | 750 | 750 | 850 | 850 | 899 | 995 | 988 |
| Median Sold Price | 950 | 881 | 865 | 875 | 830 | 900 | 903 | 950 | 868 | 900 | 915 | 916 | 1028 |