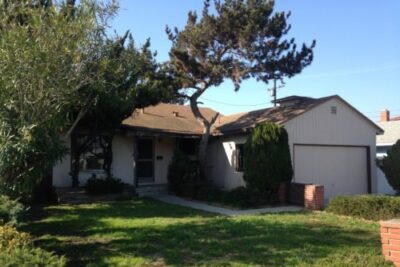
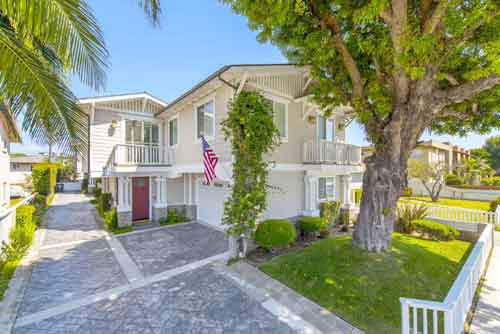
19921 Saltee Torrance

Great Opportunity for a Remodel at 19921 Saltee

Update**As of January 25th this home had received 28 offers and were no longer accepting new offers.  This wasn’t surprising given the price being so far below market value for this West Torrance neighborhood.

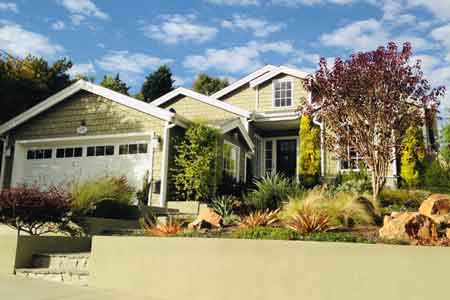
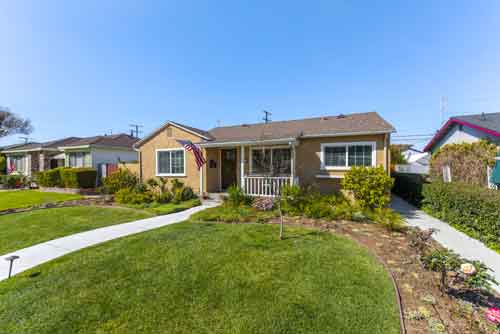
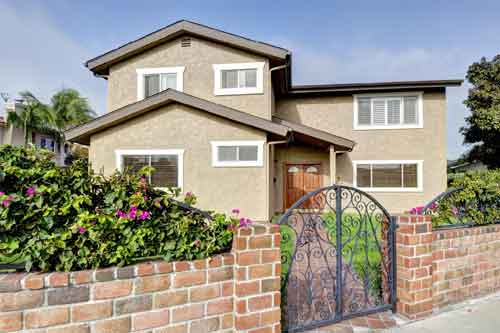
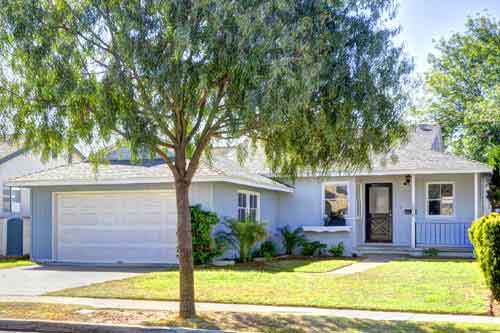
We haven’t seen a price like this in west Torrance in some time and this one is definitely on the radar for many buyers.  The home needs 19221 Saltee Torranceextensive work but has some great bones and it’s in an ideal location.  The price probably eliminates all but the most daring flippers as it probably needs additional square footage and a master bath, but it seems an ideal fit for the owner user that wants to do the rehab work themselves.  Other than the bathroom… a coat of paint, refinishing of the hardwood floors (from what we could see they were in great shape under the carpet) and lots of cosmetic love would go a very long way in making the home livable.
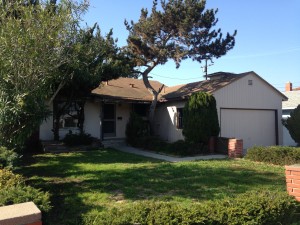
One challenge is the very odd somewhat enclosed patio leading off of the side and back of the house.  It’s just…well…odd and doesn’t feel like an indoor or outdoor space.  It also wasn’t permitted so the simplest solution is probably a sledgehammer.

Click to see the details on 19921 Saltee in West Torrance.

Torrance homes with pools

Oh How Torrance Home Values Have Changed

By Keith Kylepool-west-new

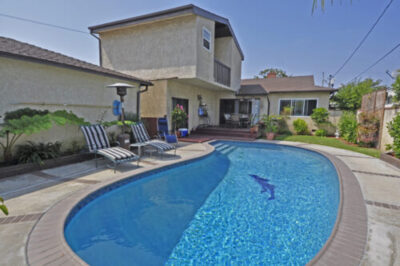
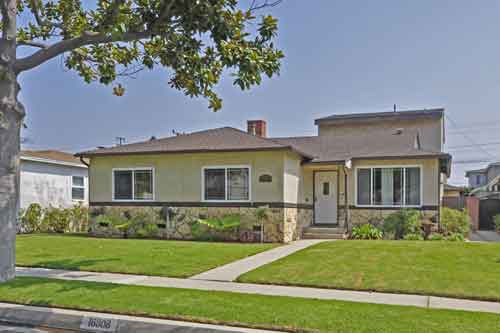
I received an odd phone call yesterday from a potential buyer that said she had been given a real estate flyer for a listing at 16808 Delia in North Torrance.  She said it was a well priced short sale and it was.  The only problem was that I sold this house at the beginning of 2012.  It had been a while since I thought of this house and upon pulling up the old listing I struck me just how dramatically the market has changed since then.  It was a very nice home, with a great yard and pool but unfortunately the owners were struggling and had to do a short sale.  We listed the home at $520,000 and it closed at $502,000.

What would it sell for now?

It would be just about impossible to find any single family home in that neighborhood, regardless of condition and size for that price in the North Torrance Homescurrent market.  That home that sold only 2 years ago would now sell for at least $750,000 which is simply incredible.  The speed with which the real estate market in Torrance and the South Bay was stunning and the changes to value equally unbelievable.

How Quickly we forget?

Another aspect of all this that struck me was just how short our memories can be.  Just 2 years ago there were so many homes with great prices and most buyers thought it would continue and go even lower.  These days the poor buyers that didn’t buy are priced completely out of neighborhoods that would have been very affordable.  The thought now is that it of course can only continue going up, but is that really the reality and has that much changed?  It’s certainly a great time to be a home seller, but not necessarily a great time to be a buyer.

[idx-listings community=”North Torrance West” statuses=”1″ propertytypes=”516″ orderby=”DateAdded” orderdir=”DESC” count=”10″]

Torrance neighborhood real estate map.

Torrance CA Real Estate Map – Search for Homes

Welcome to our Torrance CA Real Estate Map and Home Search

Torrance, California is a big city and it’s neighborhoods and areas vary considerably in the types of homes, feel of the neighborhood, and home prices.

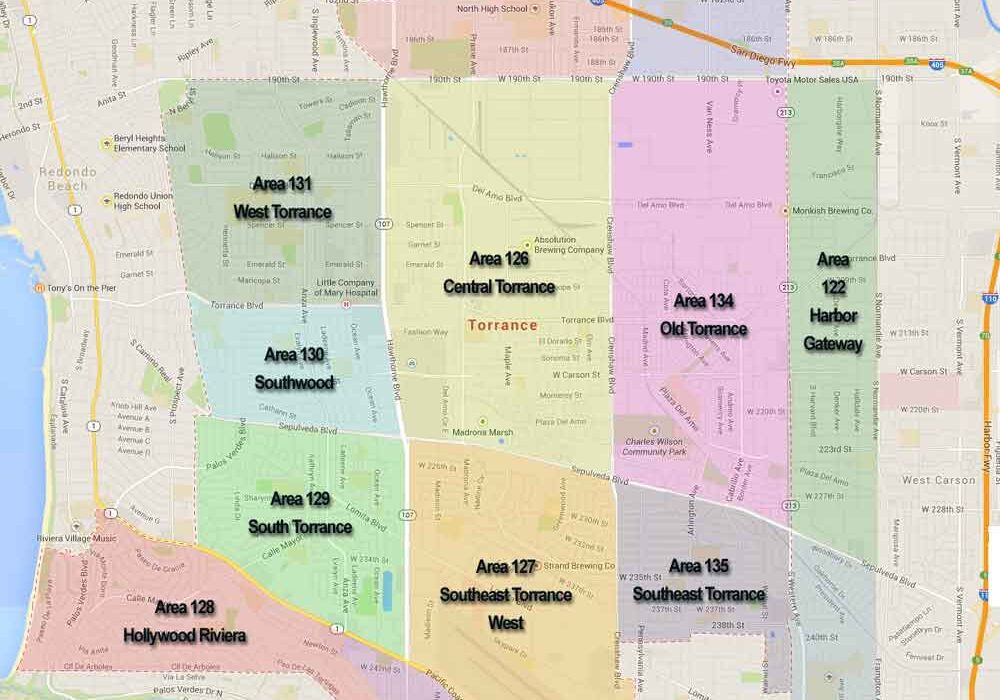
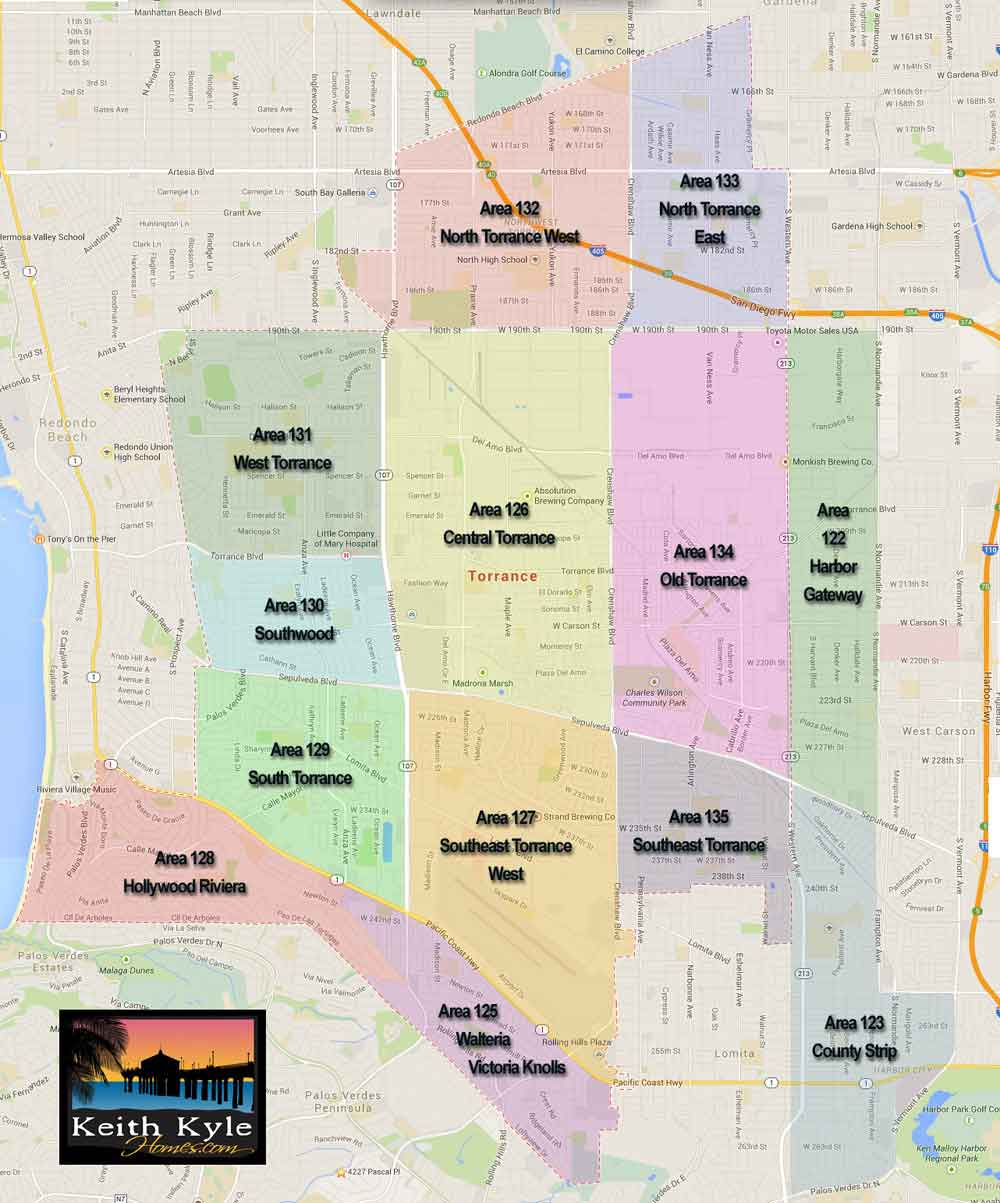
As realtors, we search for homes by neighborhood so that we can best assist our clients to find the right type of homes in the right areas.  Below is a map used by realtors and used in MLS home searches.  The numbers coincide with the areas that we use to search and each has it’s differences and similarities.  The three areas that often cause confusion are area 128 the Hollywood Riviera and areas 122 and 123, Harbor Gateway and County Strip.

Much of the Hollywood Riviera actually has Redondo Beach, 90277, zip codes but the area is actually part of Torrance and services and schools are Torrance.  The County Strip and Harbor Gateway areas actually have Torrance zip codes but are serviced by the city of Los Angeles.  It’s distance from the beach, proximity to commercial and industrial, and the schools being LA Unified makes the homes significantly less expensive then the city of Torrance areas.

The Neighborhoods of Torrance CA

North Torrance homes West Torrance homes Hollywood Riviera homes Walteria Torrance homes Southwood Torrance homes OldTorrance South Torrance homes Southeast Torrance homes Central Torrance Harbor Gateway Torrance

Search Homes in Torrance Neighborhoods

torrancehomesforsale
westtorrancehomes
southwoodtorrance
plaza del amo
old torrance homes
walteria torrance
north torrance homes
torrancerealestate
torrancehomes
redondo beach real estate

Median home prices near $600,000 for August 2014

By Keith KyleNorth Torrance Homes

August was yet another big month for home prices in Torrance and the South Bay with  average home prices continuing to rise and the busy summer season continuing at a fairly torrid pace. Home sales were down from July due to the continuing lack of homes for sale.  Click any city and month below to see the full list of homes sold.  Contact us for more information on any of the homes.

August saw a total of 117 homes sold, down from 142 in July.  Of the 117 homes sold, 82 were single family homes, 16 were townhomes, and 17 were condos.  In addition there were 9 income properties (duplex, triplex, etc.) sold  as well as.  Of the 117 4 were short sales or foreclosures showing that the foreclosure market continues to dwindle and is a non factor in the current housing market.  The median home price was $600,000 up from $540,000 the prior month.

Townhomes for sale - 2209 Nelson

July 2014 Median Home Prices in Torrance CA

By Keith Kyle

Townhomes for sale - 2209 Nelson

July 2014 saw some big numbers in terms of both number of homes sold as well as median prices.  Torrance CA  had 142 sold homes at a median price of $540,000 which was down from the same month in 2013.  Most other South Bay cities also saw some significant year over year increases in prices with the other exceptions being  Marina Del Rey and Playa Del Rey.  To see the actual homes sales in each city visit our recent home sales price and information site.

City Homes Sold July 2014 Median July 2013 Median Year over Year % Change
Carson 48 $382,500 $350,000 9.29%
El Segundo 15 $872,000 $797,000 9.41%
Gardena 50 $385,000 $332,500 15.79%
Harbor City 13 $4 80,000 $465,000 3.23%
Hawthorne homes 51 $505,000 $400,000 26.25%
Hermosa Beach 26 $1,230,000 $1,097,500 12.07%
Lawndale 8 $412,000 $331,250 24.38%
Lomita 13 $555,000 $452,000 22.79%
Long Beach 330 $400,000 $365,000 9.59%
Manhattan Beach 43 $1,795,000 $1,521,250 18.00%
Marina Del Rey 33 $757,500 $862,500 -12.17%
Palos Verdes Estates 51 $1,600,000 $1,291,000 23.93%
Playa Del Rey 23 $507,000 $512,000 -0.98%
RanchoPalos Verdes 54 $1,069,000 $1,100,000 -2.82%
Redondo Beach 97 $865,000 $758,000 14.12%
San Pedro 49 $440,000 $420,500 4.64%
Torrance 142 $540,000 $576,250 -6.29%
Westchester 48 $777,500 $715,000 8.74%

CONTACT US

for all of your Torrance real estate services

your torrance realtor

Torrance realtor Keith Kyle
Keith Kyle
Realtor

DRE#01712785

Vista Sotheby's logo

REALESTATETORRANCE – All rights reserved – Designed and Developed by Keith Kyle Homes