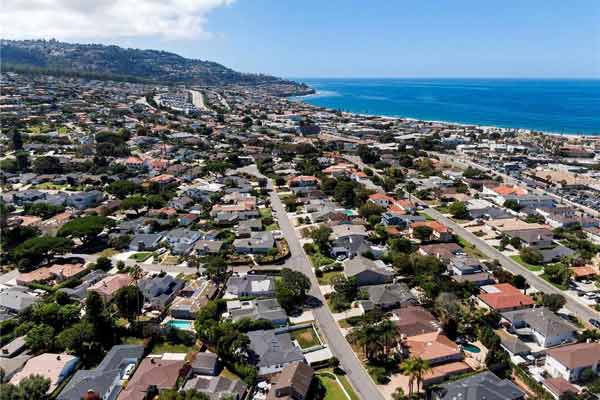
Torrance Home Sales and Median Home Prices for June 2017

June was a big month for home sales in Torrance CA with a fairly huge number of homes selling.  The summer months are always an active market and this year was no different with 184 homes selling..  Thats well above the normal number of Torrance homes selling in a month.  Median home prices were up just a bit over June of the previous year with the median home in Torrance selling at $673,000.  Click here to track all of the important real estate trends for Torrance CA.

City Homes Sold June 2017 Median June 2016 Median Year over Year % Change%
Carson 61 $445,000 $450,000 -1.1%
El Segundo 15 $800,000 $1,135,000 -29%
Gardena 70 $461,000 $430,000 7.2%
Harbor City 19 $465,000 $547,000 -15%
Hawthorne 45 $592,000 $624,000 -5.1%
Hermosa Beach 26 $1,718,000 $1,274,500 34.8
Lawndale 12 $535,000 $519,000 3.1%
Lomita 18 $565,000 $555,000 1.8%
Long Beach 419 $523,000 $470,000 11.2%
Manhattan Beach 57 $2,467,000 $1,924,000 28.2%
Marina Del Rey 34 $968,000 $900,000 7.6%
Palos Verdes Estates 46 $1,679,000 $1,533,000 9.5%
Playa Del Rey 34 $683,000 $603,000 13.3%
Rancho Palos Verdes 75 $1,240,000 $1,200,000 3.3%
Redondo Beach 117 $969,000 $945,000 2.5%
San Pedro 82 $510,000 $500,000 1.9%
Torrance 184 $673,000 $635,000 5.9%
Westchester 42 $1,090,000 $1,050,000 3.8%

See Torrance CA Home Prices for May 2017

Torrance saw a big increase in the monthly number of home sales in May 2017 with 140 homes closing escrow.  The median home price was an impressive $690,000 for the month.  See the Torrance CA real estate market trends and statistics here.  To see the homes that sold in Torrance CA for May visit our home sales page.

City Homes
Sold
May 2017 Median May 2016 Median Year over Year % Change%
Carson 41 $458,000 $453,000 1.2%
El Segundo 8 $880,000 $803,000 9.7%
Gardena 65 $523,000 $425,000 23.1%
Harbor City 14 $503,000 $439,000 14.5%
Hawthorne 46 $610,000 $485,000 25.8%
Hermosa Beach 26 $1,738,000 $1,285,000 35.3%
Lawndale 16 $485,000 $455,000 6.5%
Lomita 18 $653,000 $488,000 33.7%
Long Beach 356 $472,000 $485,000 -2.6%
Manhattan Beach 46 $2,175,000 $1,875,000 16%
Marina Del Rey 32 $933,000 $925,000 0.8%
Palos Verdes Estates 47 $1,650,000 $1,499,000 10.1%
Playa Del Rey 31 $720,000 $560,000 28.6%
Rancho Palos Verdes 51 $1,275,000 $1,060,000 20.3%
Redondo Beach 87 $1,054,000 $950,000 10.9%
San Pedro 63 $620,000 $489,000 26.8%
Torrance 140 $690,000 $593,000 16.4%
Westchester 44 $965,000 $1,130,000 -14.6%
South Redondo Beach and the Hollywood Riviera

New Real Estate Website for Home Buyers and Sellers in the Hollywood Riviera

With the individual real estate markets in the South Bay being so diverse and specialized, the larger real estate sites and portals just can’t focus on specific neighborhoods.  We are proud to announce the Hollywood Riviera real estate website HomesinHollywoodRiviera.com which will provide home buyers and sellers insight into this localized market.   From the current homes for sale and MLS listings, to determining the value of homes in the area, to finding realtors that specialize in the real estate market of the Hollywood Riviera, we hope the site is an invaluable resource for all things real estate in this wonderful coastal community.

Homes for sale in the Hollywood Riviera
Townhomes for sale - 2209 Nelson

28 Homes over $1,000,000 in Torrance

By Keith Kyle

It wasn’t long ago that a Torrance home in the million dollar range was a rarity….now it’s fairly commonplace. Currently there are 21 homes in the city of Torrance that are priced higher than this formerly elusive price. If you factor in homes in the homes for sale in the Hollywood Riviera, which has a Redondo Beach mailing address but is actually in the city of Torrance, there are actually 28 homes price over $1,000,000 with 5 homes priced over $2,000,000.


Torrance townhomes for sale - 1310 Portola in Old Torrance

December 2016 Home Prices in Torrance CA

By Keith Kyle

December was a pretty typical month in Torrance real estate with 112 home sales at a median price of $656,000.  December traditionally is a much slower month but with the continued demand for Torrance homes, there doesn’t seem to be such a thing as a slow month.  Click here to see the sold homes in Torrance for December.  For the current homes for sale visit our active listings page.

City Homes
Sold
December
2016 Median
December
2015 Median
Year
over Year % Change%
Carson 54 $450,000 $420,000 7%
El Segundo 14 $816,000 $1,171,000 -30.3%
Gardena 44 $504,000 $413,000 22.1%
Harbor City 9 $523,000 $404,000 29.5%
Hawthorne 37 $575,000 $520,000 10.6%
Hermosa Beach 17 $1,380,000 $1,625,000 -15.1%
Lawndale 8 $393,000 $521,000 -24.6%
Lomita 6 $473,000 $535,000 -11.6%
Long Beach 298 $490,000 $435,000 12.6%
Manhattan Beach 38 $1,863,000 $1,831,000 1.7%
Marina Del Rey 21 $955,000 $945,000 1.1%
Palos Verdes Estates 25 $1,550,000 $1,675,000 -7.5%
Playa Del Rey 20 $658,000 $612,000 7.5%
Rancho Palos Verdes 47 $1,088,000 $945,000 15.1%
Redondo Beach 75 $900,000 $855,000 5.3%
San Pedro 58 $515,000 $485,000 6.3%
Torrance 112 $656,000 $585,000 12.1%
Westchester 32 $943,000 $892,000 5.7%

Torrance Home Sales and Housing Prices for November 2016

By Keith Kyle

Torrance, CA posted some solid home sales numbers in November 2015 with a very healthy 112 homes selling at a median price of $656,000 which was up considerably over November of the previous year.  To see the home sales in Torrance click here.  Torrance is one of the largest cities in the South Bay with a very diverse housing market.

City Homes
Sold
November
2016 Median
November
2015 Median
Year
over Year % Change%
Carson 54 $450,000 $420,000 7%
El Segundo 14 $816,000 $1,171,000 -30.3%
Gardena 44 $504,000 $413,000 22%
Harbor City 9 $523,000 $404,000 29.5%
Hawthorne 37 $575,000 $520,000 10.6%
Hermosa Beach 17 $1,380,000 $1,625,000 -15%
Lawndale 8 $393,000 $521,000 -24.6%
Lomita 6 $473,000 $535,000 -11.6%
Long Beach 298 $490,000 $435,000 12.6%
Manhattan Beach 38 $1,863,000 $1,831,000 1.7%
Marina Del Rey 21 $955,000 $945,000 1.1%
Palos Verdes Estates 25 $1,550,000 $1,675,000 -7.5%
Playa Del Rey 20 $658,000 $612,000 7.5%
Rancho Palos Verdes 47 $1,088,000 $945,000 15.1%
Redondo Beach 75 $900,000 $855,000 5.3%
San Pedro 58 $515,000 $485,000 6.3%
Torrance 112 $656,000 $585,000 12.1%
Westchester 32 $943,000 $892,000 5.7%