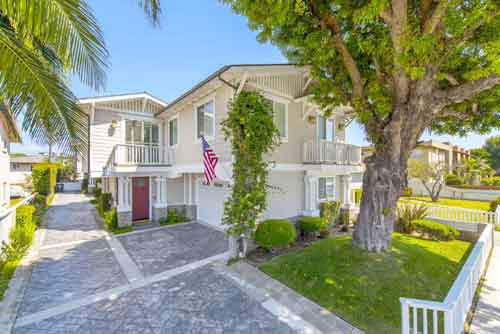
Just Listed in The Breakers – 2889 Plaza Del Amo #515

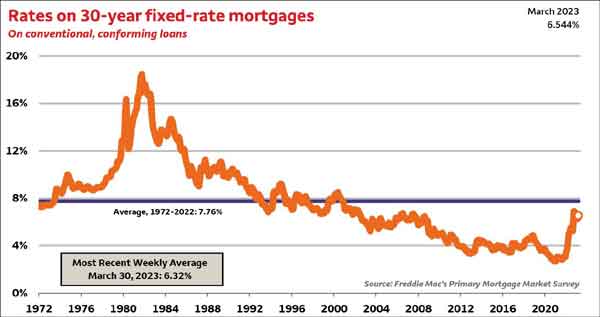
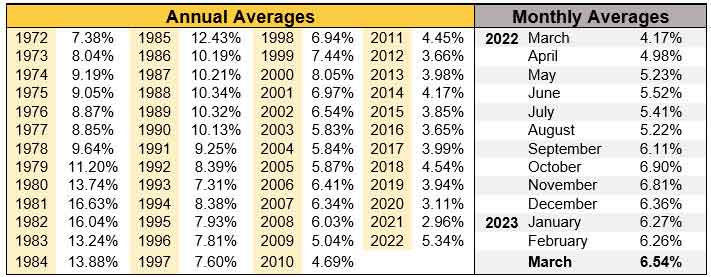
Many Torrance CA buyers are concerned with interest rates rising with the Fed making it clear that rates will slowly increats. That’s certainly a valid concern for potential Torrance homebuyers as a higher interest rate means a higher monthly payment which most often means a lower priced home. Taken in historical standpoint the current rates are dramatically lower than at just about any other time. The chart below shows the interest rate on conventional and conforming 30 year fixed rate mortgages. As we’ll see we’ve basically seen rates drop consistently since the high water mark of 16.3% in 1981. It certainly makes todays current rate in the mid 4% range seem pretty enticing.
By Keith Kyle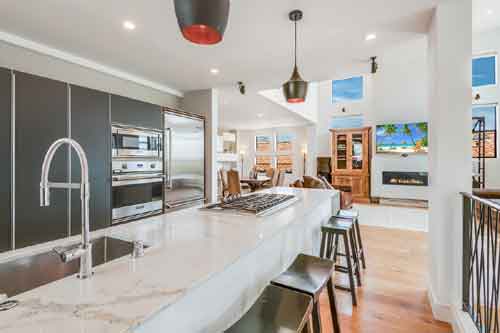
It wasn’t long ago that a Torrance home in the million dollar range was a rarity….now it’s fairly commonplace. Currently there are 21 homes in the city of Torrance that are priced higher than this formerly elusive price. If you factor in homes in the homes for sale in the Hollywood Riviera, which has a Redondo Beach mailing address but is actually in the city of Torrance, there are actually 28 homes price over $1,000,000 with 5 homes priced over $2,000,000.
By Keith Kyle
August 2016 saw another strong month for homes throughout the South Bay and Torrance. Torrance, CA reached a 179 homes sold in the month of August with a median home price of $645,000. As of October 18th 2016 there are 151 active homes and income properties for sale in Redondo Beach and 173 homes currently in escrow. The lowest price of the month was a one bedroom condo in a 55+ building at $215,000 with the highest sale a $1,225,000 for a single family home in the Southwood community of Torrance. Of all the homes sold only one was a short sale or foreclosure showing just how much of a non factor short sales are becoming in Torrance. View the current homes for sale in Torrance, CA or view a list of the homes sold in Redondo Beach and the South Bay in August.
| City | Homes Sold | August 2016 Median | August 2015 Median | Yearover Year % Change% |
| Carson | 56 | $450,000 | $430,000 | 4.7% |
| El Segundo | 15 | $1,075,000 | $780,000 | 37.8% |
| Gardena | 43 | $470,000 | $399,000 | 17.8% |
| Harbor City | 24 | $523,000 | $450,000 | 16.1% |
| Hawthorne | 47 | $575,000 | $493,000 | 16.8% |
| Hermosa Beach | 22 | $1,723,000 | $1,389,000 | 24.% |
| Lawndale real estate | 16 | $498,000 | $437,000 | 13.8% |
| Lomita | 23 | $619,000 | $510,000 | 21.4% |
| Long Beach | 348 | $463,000 | $459,000 | .8% |
| Manhattan Beach | 36 | $1,800,000 | $1,923,000 | -6.4% |
| Marina Del Rey | 24 | $1,059,000 | $928,000 | 14.1% |
| Palos Verdes Estates | 42 | $1,412,000 | $1,815,000 | -22.2% |
| Playa Del Rey | 16 | $623,000 | $560,000 | 11.2% |
| Rancho Palos Verdes | 57 | $1,065,000 | $1,155,000 | -7.8% |
| Redondo Beach | 100 | $968,000 | $842,000 | 15% |
| San Pedro | 70 | $481,000 | $475,000 | 1.3% |
| Torrance | 179 | $645,000 | $585,000 | 10.3% |
| Westchester | 44 | $1,093,000 | $890,000 | 22.7% |
By Keith Kyle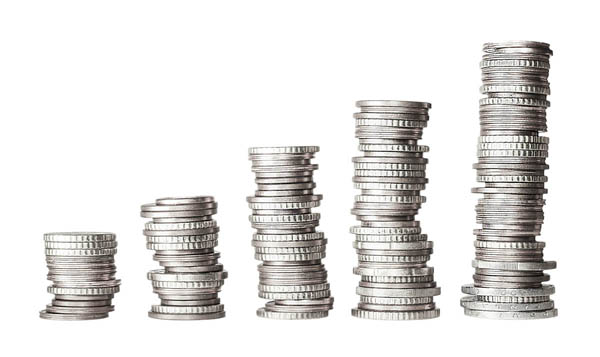
I’ve noticed an early January trend in some of the local markets as many homes now seem to be listed at prices that recent sales just don’t seem to justify. Will this overpricing help slow the market down a little as we’re starting to see some homes sit on the market and even eventual price reductions.
We’ve seen the market increase in value dramatically in the past 12 months with values generally rising each month but since late November we seem to be seeing more homes priced well above the current market and well above the pricing trend. Only time will tell what 2014 has in store in the Beach Cities real estate market but as perception is such a real part of real estate, buyers now seeing homes sit on the market without selling may mark the beginning of a slow down.