Torrance Market Update – March 2020 Home Sales in Torrance CA
March 2020 was another solid month for real estate in Torrance CA….the South Bay’s largest city. There were 84 on market closed sales during the month which is down slightly from March 2019 but was still the highest since the beginning of 2020. The number of pending sales has jumped considerable each month of 2020 thus far so one would have expected that to continue.
View the current homes for sale in Torrance
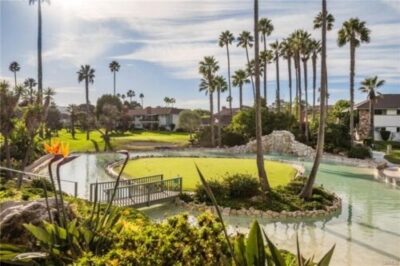
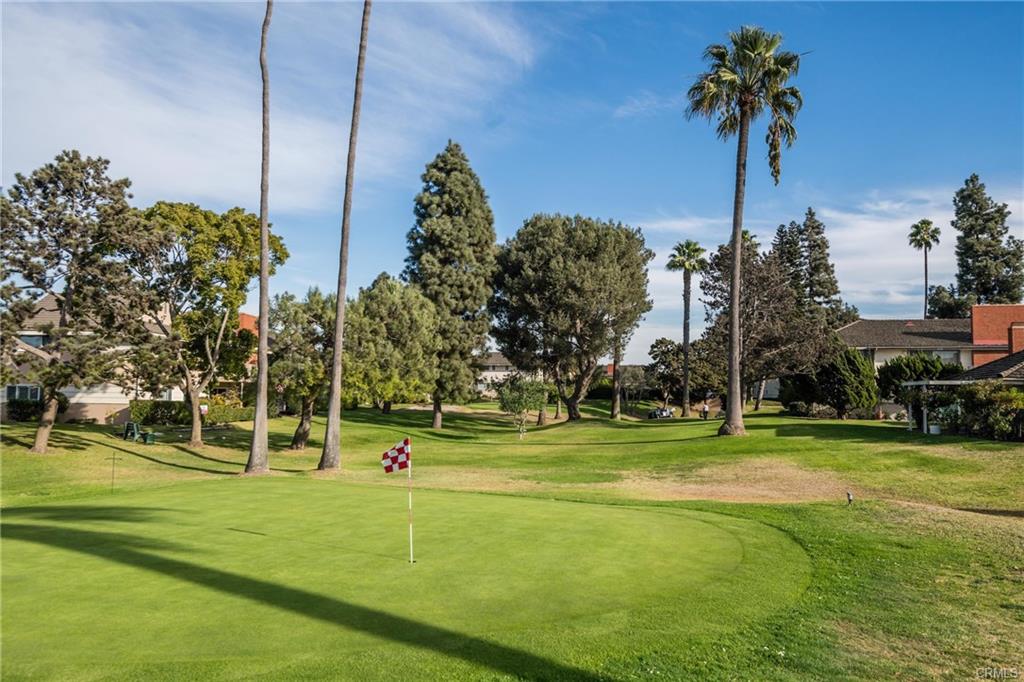
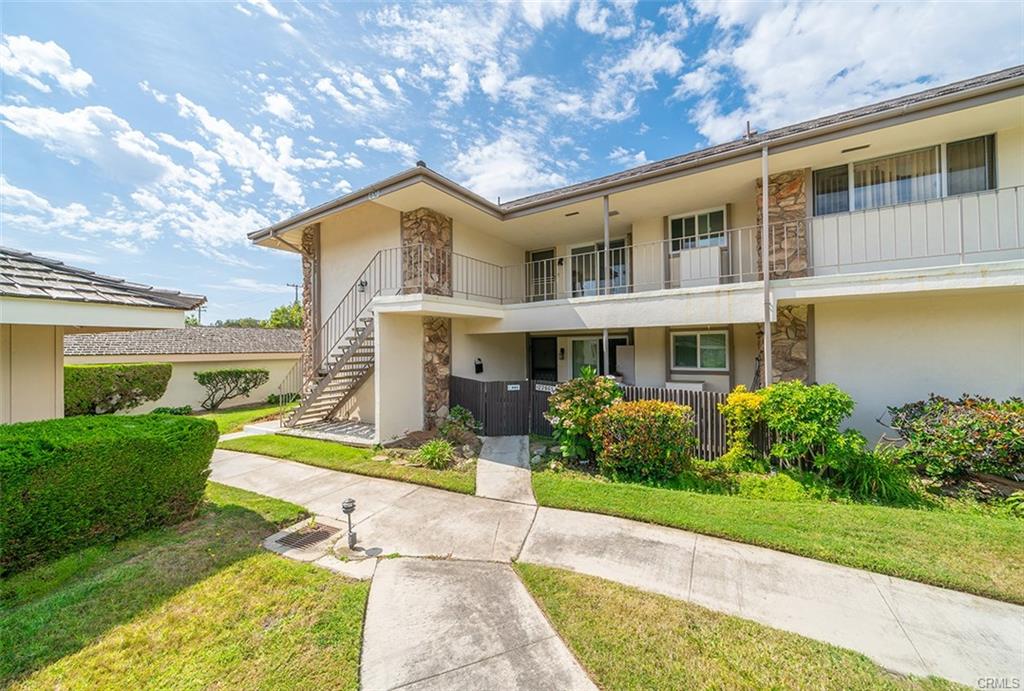
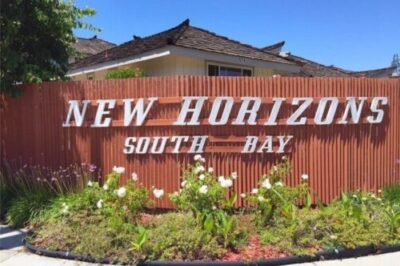
March numbers were not yet impacted by Covid 19 so that will likely change things quite a bit as many “pending” escrows have fallen out and are now back on the market. The median asking price was $787,000 with the median “sold” price at $815,000 which means that home were selling WAY over the list price indicating a market VERY favorable to sellers. The average price per foot was $515.80 and median days on the market was only 9 before going into escrow. 4 of the sales were in the 55+ community of New Horizons which was certainly more than any other specific neighborhood.
March 2020 Torrance Home Sales
| Type | Address | Price | $ Per Foot | Bed/Bath | Sq Feet | Year Built | Sold Date | |
| TWNHS | 1445 W | 224TH ST #5 | $495,000 | $348.59 | 3/1,1,1,0 | 1420/A | 2007/ASR | 3/10/2020 |
| CONDO/A | 20434 S | Vermont AVE #72 | $267,500 | $407.77 | 1/1,0,0,0 | 656/A | 1978/ASR | 3/13/2020 |
| CONDO/A | 1129 | Sepulveda BLVD #M201 | $348,000 | $437.19 | 2/1,0,0,0 | 796/A | 1973/ASR | 3/25/2020 |
| CONDO/A | 23334 | Sesame ST #C | $360,000 | $434.26 | 2/2,0,0,0 | 829/A | 1973/ASR | 3/16/2020 |
| CONDO/A | 806 | Coriander DR #G | $365,000 | $440.29 | 2/2,0,0,0 | 829/A | 1973/ASR | 3/27/2020 |
| CONDO/A | 21858 S | Vermont Av #4 | $377,000 | $403.64 | 2/2,0,0,0 | 934/A | 1994/ASR | 3/2/2020 |
| CONDO/A | 23334 | Sesame ST | $390,000 | $470.45 | 2/1,1,0,0 | 829/A | 1973/ASR | 3/3/2020 |
| SFR/D | 23033 | Alexandria AVE | $420,000 | $259.42 | 3/1,0,0,0 | 1619/A | 1956/ASR | 3/27/2020 |
| SFR/D | 1056 W | 220th ST | $461,500 | $456.03 | 3/1,0,0,0 | 1012/A | 1952/PUB | 3/4/2020 |
| SFR/D | 1040 | Fiat ST | $500,000 | $520.83 | 3/1,0,0,0 | 960/A | 1954/ASR | 3/5/2020 |
| SFR/D | 23111 | Alexandria AVE | $540,000 | $575.69 | 2/1,0,1,0 | 938/A | 1956/ASR | 3/27/2020 |
| SFR/D | 1057 | Fiat ST | $542,000 | $564.58 | 3/1,0,0,0 | 960/A | 1954/ASR | 3/26/2020 |
| SFR/D | 21419 | Marigold AVE | $580,000 | $428.99 | 3/1,1,0,0 | 1352/A | 1959/ASR | 3/10/2020 |
| SFR/D | 711 | Gian DR | $730,000 | $302.03 | 4/3,0,0,0 | 2417/A | 1968/EST | 3/25/2020 |
| SFR/D | 22530 | Meyler ST | $735,000 | $422.66 | 4/2,0,0,0 | 1739/A | 1961/ASR | 3/23/2020 |
| SFR/D | 2611 | Nearcliff ST | $774,000 | $735.04 | 3/1,0,0,0 | 1053/A | 1954/ASR | 3/27/2020 |
| SFR/D | 3202 | Singingwood DR | $850,009 | $421.84 | 3/3,0,0,0 | 2015/A | 1976/ASR | 3/10/2020 |
| SFR/D | 3314 | Danaha ST | $878,700 | $631.70 | 3/2,0,0,0 | 1391/A | 1949/ASR | 3/27/2020 |
| SFR/D | 3326 | Primm WAY | $900,000 | $843.49 | 3/1,0,0,0 | 1067/A | 1950/ASR | 3/26/2020 |
| SFR/D | 25811 | Matfield DR | $921,000 | $594.19 | 3/2,0,0,0 | 1550/A | 1956/ASR | 3/24/2020 |
| SFR/D | 3506 | Senefeld DR | $940,000 | $755.63 | 3/2,0,0,0 | 1244/A | 1951/ASR | 3/6/2020 |
| SFR/D | 3014 | Softwind WAY | $1,065,000 | $575.05 | 3/3,0,0,0 | 1852/A | 1975/ASR | 3/25/2020 |
| SFR/D | 3321 | Candlewood RD | $1,300,000 | $520.21 | 4/3,0,1,0 | 2499/A | 1975/ASR | 3/26/2020 |
| DPLX/D | 24458 | Park ST | $1,599,000 | $533.00 | 5/3,0,0,0 | 3000/A | 1962/ASR | 3/9/2020 |
| TWNHS/A | 3101 | Plaza Del Amo #104 | $623,000 | $525.30 | 2/2,0,1,0 | 1186/A | 1986/ASR | 3/16/2020 |
| TWNHS/A | 2971 | Plaza Del Amo #293 | $658,000 | $483.47 | 2/3,0,0,0 | 1361/A | 1985/ASR | 3/20/2020 |
| TWNHS/A | 3538 | Torrance BLVD #156 | $815,000 | $454.80 | 3/2,0,1,0 | 1792/A | 2005/ASR | 3/24/2020 |
| SFR/D | 2510 | Dorset | $1,065,000 | $431.17 | 4/2,0,1,0 | 2470/A | 1991/ASR | 3/27/2020 |
| CONDO/A | 22647 | Nadine CIR #A | $443,000 | $396.60 | 1/2,0,0,0 | 1117/A | 1963/PUB | 3/13/2020 |
| CONDO/A | 22645 | Nadine CIR #B | $455,000 | $407.34 | 2/2,0,0,0 | 1117/A | 1963/ASR | 3/12/2020 |
| CONDO/A | 22913 | Maple AVE #B | $475,000 | $425.25 | 2/2,0,0,0 | 1117/P | 1963/ASR | 3/6/2020 |
| CONDO/A | 22628 | Nadine CIR #A | $490,000 | $515.79 | 2/2,0,0,0 | 950/A | 1963/PUB | 3/31/2020 |
| CONDO/A | 23016 | Nadine CIR | $515,000 | $532.57 | 2/1,0,0,0 | 967/A | 1963/ASR | 3/2/2020 |
| SFR/D | 3514 W | 224th ST | $862,500 | $544.85 | 3/1,0,1,0 | 1583/A | 1954/ASR | 3/24/2020 |
| SFR/D | 22910 | Wade AVE | $1,185,000 | $357.79 | 4/2,0,1,0 | 3312/A | 1976/ASR | 3/13/2020 |
| SFR/D | 4317 | Highgrove AVE | $1,050,000 | $630.25 | 3/1,0,1,0 | 1666/A | 1954/ASR | 3/9/2020 |
| SFR | 4427 | VISTA LARGO | $1,325,000 | $784.02 | 4/2,0,1,0 | 1690/ | 1958 | 3/6/2020 |
| SFR/D | 4621 | Via El Sereno | $1,428,015 | $653.85 | 4/1,2,0,0 | 2184/A | 1963/ASR | 3/19/2020 |
| SFR/D | 4002 W | 234th ST | $830,000 | $547.49 | 3/2,0,0,0 | 1516/A | 1961/ASR | 3/18/2020 |
| SFR/D | 23224 | Anza AVE | $940,000 | $554.25 | 4/2,0,0,0 | 1696/E | 1960/EST | 3/4/2020 |
| SFR/D | 23633 | Ladeene AVE | $980,000 | $655.08 | 3/1,1,0,0 | 1496/A | 1962/ASR | 3/23/2020 |
| SFR/D | 4616 | mindora DR | $990,000 | $769.83 | 3/0,1,0,0 | 1286/A | 1951/ASR | 3/16/2020 |
| SFR | 4134 | PACIFIC COAST HWY #124 | $1,087,000 | $434.80 | 3/2,0,1,0 | 2500/AP | 2001 | 3/17/2020 |
| SFR/D | 5130 | Sepulveda BLVD | $1,100,100 | $428.22 | 4/2,2,0,0 | 2569/A | 1952/ASR | 3/13/2020 |
| SFR | 22329 | LADEENE AVE | $1,269,400 | $575.43 | 4/3,0,0,0 | 2206/ | 1953 | 3/23/2020 |
| SFR/D | 22312 | Ladeene AVE | $1,270,000 | $488.46 | 5/3,0,0,0 | 2600/A | 1953/ASR | 3/31/2020 |
| SFR/D | 23203 | Los Codona AVE | $1,344,015 | $604.32 | 4/3,0,0,0 | 2224/A | 1965/ASR | 3/3/2020 |
| SFR/D | 3855 | Tiffany CT | $1,360,000 | $436.88 | 5/3,0,0,0 | 3113/A | 1977/ASR | 3/3/2020 |
| SFR | 22006 | ANZA AVE | $895,000 | $563.96 | 3/2,0,0,0 | 1587/ | 1956 | 3/4/2020 |
| SFR/D | 22117 | Palos Verdes BLVD | $948,000 | $522.89 | 3/2,0,0,0 | 1813/A | 1955/ASR | 3/27/2020 |
| SFR/D | 21509 | Ladeene AVE | $1,277,000 | $674.95 | 4/3,0,1,0 | 1892/A | 1956/PUB | 3/13/2020 |
| TWNHS/A | 4438 | Spencer ST #9 | $730,000 | $431.70 | 2/2,0,1,0 | 1691/A | 1984/ASR | 3/27/2020 |
| TWNHS/A | 5208 W | 190th ST | $775,000 | $423.27 | 3/1,1,1,0 | 1831/P | 1976/ASR | 3/12/2020 |
| SFR/D | 4770 W | 191st ST | $890,000 | $485.81 | 3/1,0,0,0 | 1832/A | 1954/ASR | 3/1/2020 |
| SFR/D | 19521 | Beckworth AVE | $945,000 | $540.00 | 3/1,1,0,0 | 1750/A | 1954/ASR | 3/11/2020 |
| SFR/D | 5019 | Halison ST | $1,074,000 | $561.13 | 4/2,0,0,0 | 1914/A | 1973/ASR | 3/4/2020 |
| SFR/D | 5009 | Maricopa ST | $1,451,000 | $593.94 | 5/2,0,1,0 | 2443/A | 1959/ASR | 3/24/2020 |
| TWNHS/A | 4033 W | 182nd ST #C | $475,000 | $287.53 | 2/1,0,1,0 | 1652/A | 1980/ASR | 3/16/2020 |
| SFR/D | 4303 W | 178th ST | $708,000 | $679.46 | 2/2,0,0,0 | 1042/A | 1949/ASR | 3/24/2020 |
| SFR/D | 3705 W | 180th PL | $715,000 | $642.99 | 3/1,0,0,0 | 1112/A | 1953/ASR | 3/26/2020 |
| SFR/D | 3705 W | 180th PL | $715,000 | $642.99 | 3/1,0,0,0 | 1112/P | 1953/ASR | 3/26/2020 |
| SFR/D | 3924 W | 187TH ST | $790,000 | $670.63 | 3/1,0,1,0 | 1178/A | 1956/ASR | 3/11/2020 |
| SFR/D | 16703 | Ermanita AVE | $800,000 | $638.98 | 3/2,0,0,0 | 1252/A | 1952/ASR | 3/25/2020 |
| SFR/D | 3116 W | 185th ST | $860,000 | $564.30 | 3/1,1,0,0 | 1524/A | 1950/ASR | 3/5/2020 |
| SFR/D | 18426 | Yukon AVE | $950,000 | $484.20 | 4/2,0,1,0 | 1962/A | 1954/ASR | 3/17/2020 |
| TWNHS/A | 18413 | Van Ness AVE | $560,000 | $423.92 | 2/1,1,1,0 | 1321/A | 1964/ASR | 3/4/2020 |
| SFR/D | 1948 W | 187th PL | $625,000 | $496.03 | 3/2,0,0,0 | 1260/A | 1958/ASR | 3/5/2020 |
| SFR/D | 18825 | Wilton PL | $661,500 | $443.36 | 3/2,0,0,0 | 1492/A | 1951/ASR | 3/10/2020 |
| SFR/D | 18410 | Haas AVE | $779,000 | $628.23 | 3/1,1,0,0 | 1240/A | 1955/ASR | 3/20/2020 |
| SFR/D | 18049 | Saint Andrews PL | $815,000 | $378.01 | 4/3,0,0,0 | 2156/A | 1961/ASR | 3/26/2020 |
| SFR/D | 16216 | Taylor CT | $832,000 | $509.18 | 3/2,0,0,0 | 1634/A | 1953/ASR | 3/17/2020 |
| SFR/D | 17020 | Kristin AVE | $840,000 | $701.17 | 3/2,0,0,0 | 1198/A | 1955/ASR | 3/3/2020 |
| SFR/D | 2131 W | 184th ST | $851,000 | $425.07 | 3/1,1,0,0 | 2002/A | 1962/ASR | 3/4/2020 |
| SFR/D | 1012 | Sierra PL | $680,000 | $564.78 | 2/1,1,0,0 | 1204/A | 1950/ASR | 3/19/2020 |
| TWNHS/A | 2714 | Cabrillo AVE | $705,000 | $427.27 | 2/2,0,1,0 | 1650/A | 2006/PUB | 3/2/2020 |
| TWNHS/A | 1800 | Oak ST #351 | $756,000 | $507.38 | 2/2,0,1,0 | 1490/A | 2007/ASR | 3/17/2020 |
| TWNHS/A | 2303 | Jefferson ST #1208 | $859,000 | $403.10 | 3/3,0,0,0 | 2131/B | 2010/ASR | 3/6/2020 |
| SFR/D | 2416 | Santa Cruz CT | $899,000 | $386.67 | 3/2,0,0,0 | 2325/A | 1977/PUB | 3/16/2020 |
| SFR/D | 1767 W | 245th ST | $620,000 | $573.01 | 3/1,0,0,0 | 1082/A | 1952/ASR | 3/17/2020 |
| SFR/D | 23727 | Alliene AVE | $770,000 | $691.20 | 3/1,0,0,0 | 1114/A | 1953/ASR | 3/11/2020 |
| SFR/D | 2409 W | 235th ST | $885,000 | $492.76 | 4/2,0,0,0 | 1796/A | 1959/ASR | 3/20/2020 |
| SFR/D | 2416 | W 228th St | $920,000 | $519.48 | 3/2,0,0,0 | 1771/A | 1971/ASR | 3/10/2020 |
| SFR/D | 2371 W | 235th PL | $1,150,000 | $511.11 | 5/3,0,0,0 | 2250/A | 1963/ASR | 3/3/2020 |
| CONDO/A | 3220 | Merrill DR #43 | $325,000 | $477.94 | 1/1,0,0,0 | 680/A | 1964/ASR | 3/10/2020 |
 pretty slow month in terms of home sales in Torrance. There were 61 home sales/closed sales during the month which is considerably lower than the norm. Compare that with 101 sales in December, 90 in November and 119 in October and you can see just how slow it was.