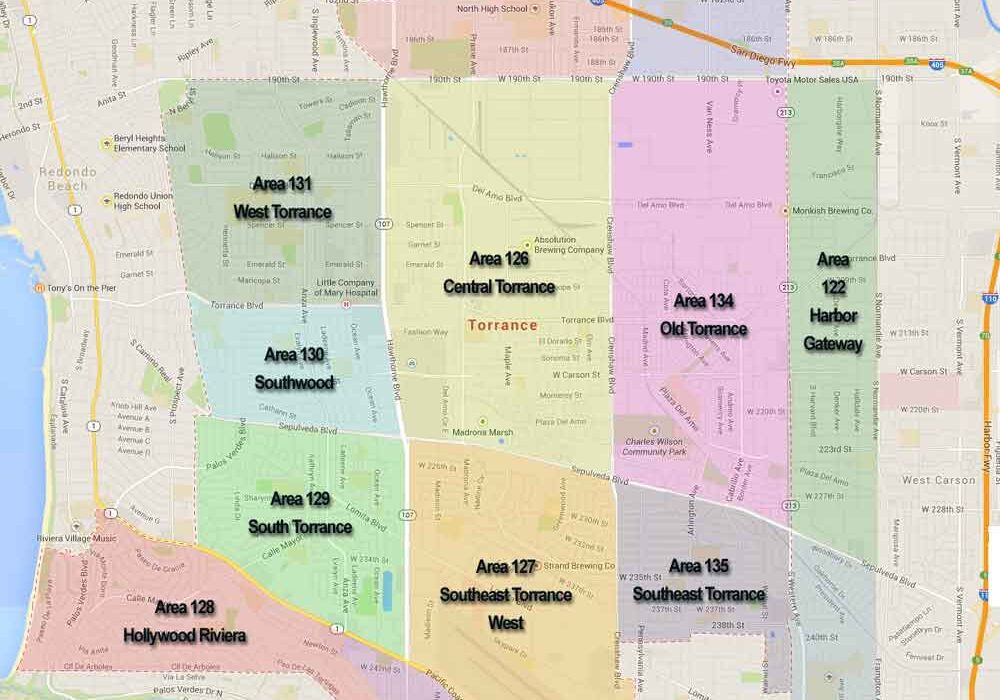
Torrance Home Prices for October 2019 – Real Estate Update
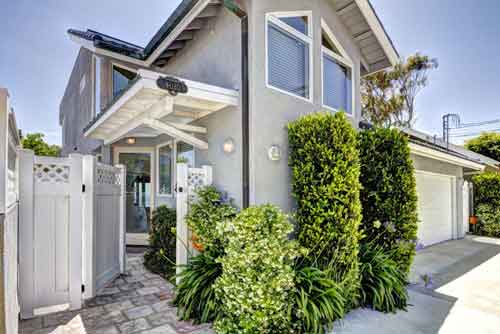
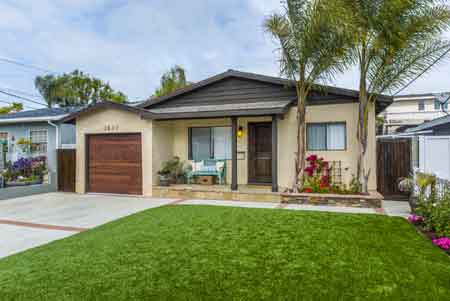
The real estate market in Torrance was fairly typical for this time of year with 119 homes selling in October of 2019. That’s a solid number and prices were strong as well. The median list price for homes that sold was $725,000 and the median sold price was $741,000 indicating the continuation of a strong seller’s market. As of this post there are 118 homes for sale in the various neighborhoods of Torrance. The lowest price of the month was $282,000 for a 1 bedroom condo in the Harbor Gateway area (not technically Torrance but a Torrance mailing address) with the highest price of the month was $1.4M. Median price per square foot for the month was at $501.62 and average days on market was just around 30. See the latest real estate trends and market statistics.
View the current homes for sale in Torrance CA
|
MLS #
|
Type
|
Address | Sold Price | $ per Foot |
Bed/Bath
|
Sq Feet
|
Year
|
Sold Date
|
|
|
SB19123191
|
TWNHS/A
|
21741 | Harvard BLVD #1 | $470,000 | $336.44 |
3/3,0,0,0
|
1397/A
|
1991/APP
|
10/3/2019
|
|
PV19191396
|
TWNHS/A
|
1611 W | 208th ST #3 | $512,600 | $275.59 |
3/3,0,0,0
|
1860/A
|
2007/PUB
|
10/28/2019
|
|
SB19239550
|
SFR/D
|
1229 W | 212th ST | $541,000 | $591.26 |
2/1,0,0,0
|
915/A
|
1954/PUB
|
10/25/2019
|
|
SB19218903
|
SFR/D
|
1649 W | 222nd ST | $586,100 | $503.52 |
3/1,1,0,0
|
1164/A
|
1947/ASR
|
10/15/2019
|
|
SB19210449
|
SFR/D
|
21129 | La Salle AVE | $590,000 | $656.28 |
2/1,0,0,0
|
899/A
|
1949/ASR
|
10/25/2019
|
|
SB19159614
|
SFR/D
|
1314 W | 214th ST | $594,000 | $471.43 |
3/2,0,0,0
|
1260/A
|
1959/ASR
|
10/3/2019
|
|
SB19232246
|
SFR/D
|
20917 | Normandie AVE | $600,000 | $364.52 |
3/2,0,0,0
|
1646/A
|
1951/ASR
|
10/21/2019
|
|
TR19213081
|
SFR/D
|
20836 | Denker AVE | $685,000 | $382.68 |
3/1,1,0,0
|
1790/E
|
1952/PUB
|
10/30/2019
|
|
SB19170658
|
SFR/D
|
20903 | Dalton AVE | $702,605 | $486.23 |
3/1,1,0,0
|
1445/A
|
1953/ASR
|
10/25/2019
|
|
SB19200431
|
SFR/D
|
20947 | Halldale AVE | $731,000 | $472.22 |
2/2,0,0,0
|
1548/A
|
1952/ASR
|
10/10/2019
|
|
SB19150092
|
CONDO/A
|
23304 | Sesame ST #J | $282,000 | $441.31 |
1/1,0,0,0
|
639/A
|
1973/ASR
|
10/16/2019
|
|
SB19213430
|
CONDO/A
|
21415 | S. Vermont Avenue #61 | $306,000 | $552.35 |
1/1,0,0,0
|
554/A
|
1990/ASR
|
10/24/2019
|
|
SB19150161
|
CONDO/A
|
1109 | Sepulveda BLVD #E201 | $310,000 | $501.62 |
1/1,0,0,0
|
618/A
|
1973/ASR
|
10/1/2019
|
|
PW19190626
|
CONDO/A
|
20545 S | Vermont AVE #4 | $318,500 | $481.85 |
1/1,0,0,0
|
661/A
|
1982/ASR
|
10/4/2019
|
|
SB19209680
|
CONDO/A
|
20415 S | Vermont AVE #8 | $325,000 | $496.94 |
1/1,0,0,0
|
654/E
|
1980/EST
|
10/10/2019
|
|
SB19207433
|
CONDO/A
|
21846 S | Vermont Ave #5 | $395,000 | $422.91 |
2/2,0,0,0
|
934/A
|
1998/ASR
|
10/10/2019
|
|
SB19208712
|
CONDO/A
|
22346 | Harbor Ridge LN #3 | $396,250 | $362.87 |
2/2,0,0,0
|
1092/A
|
1980/ASR
|
10/3/2019
|
|
SB19208757
|
TWNHS/A
|
23202 | Sesame ST #G | $415,000 | $390.04 |
3/1,0,1,0
|
1064/A
|
1973/ASR
|
10/29/2019
|
|
19495982
|
SFR/D
|
740 W | 219TH ST | $422,000 | $281.33 |
4/2,0,0,0
|
1500/E
|
1953
|
10/7/2019
|
|
PW19200990
|
TWNHS/A
|
22317 | Harbor Ridge LN #5 | $450,000 | $349.65 |
3/1,0,1,0
|
1287/A
|
1979/ASR
|
10/2/2019
|
|
SB19202474
|
SFR/D
|
21145 | Broadwell AVE | $520,000 | $418.01 |
2/1,0,0,0
|
1244/A
|
1954/ASR
|
10/10/2019
|
|
SB19117730
|
TWNHS/A
|
22320 | Harbor Ridge LN #2 | $521,000 | $291.39 |
3/1,1,1,0
|
1788/A
|
1979/ASR
|
10/11/2019
|
|
SB19193960
|
SFR/D
|
1051 | Greenhedge ST | $575,000 | $668.60 |
3/1,0,0,0
|
860/A
|
1953/ASR
|
10/31/2019
|
|
DW19181918
|
SFR/D
|
21520 | Budlong AVE | $595,000 | $485.71 |
3/1,0,0,0
|
1225/A
|
1956/ASR
|
10/18/2019
|
|
SB19203622
|
SFR/D
|
22114 | Kenwood AVE | $618,000 | $465.01 |
3/2,0,0,0
|
1329/A
|
1970/PUB
|
10/31/2019
|
|
OC19162432
|
SFR/D
|
928 | Lindencliff ST | $633,000 | $338.14 |
3/2,0,0,0
|
1872/A
|
1967/PUB
|
10/18/2019
|
|
PV19188355
|
SFR/D
|
21312 | Meyler AVE | $650,000 | $427.35 |
3/1,1,0,0
|
1521/A
|
1959/ASR
|
10/25/2019
|
|
PV19205360
|
TWNHS/D
|
1212 | Valle CT | $679,000 | $359.07 |
3/3,0,0,0
|
1891/A
|
2005/ASR
|
10/1/2019
|
|
BB19209529
|
SFR/A
|
951 | Sorock DR | $680,000 | $432.57 |
4/1,1,0,0
|
1572/A
|
1956/ASR
|
10/17/2019
|
|
PW19219372
|
TWNHS/D
|
22712 | Meyler ST | $700,000 | $405.33 |
4/3,0,0,0
|
1727/A
|
2016/PUB
|
10/21/2019
|
|
SB19215326
|
CONDO/A
|
24542 | Park ST | $575,000 | $563.17 |
2/2,0,0,0
|
1021/A
|
1984/ASR
|
10/22/2019
|
|
SB19210577
|
SFR/D
|
3127 | Winlock RD | $700,000 | $815.85 |
2/1,0,0,0
|
858/A
|
1950/ASR
|
10/16/2019
|
|
SB19219614
|
SFR/D
|
2603 | Grand Summit RD | $750,000 | $657.89 |
3/1,0,0,0
|
1140/A
|
1954/ASR
|
10/31/2019
|
|
SB19173503
|
SFR/D
|
3241 | Cricklewood ST | $795,000 | $617.72 |
3/1,0,0,0
|
1287/SEE
|
1950/ASR
|
10/11/2019
|
|
SB19223401
|
SFR/D
|
2907 | Dalemead ST | $810,000 | $810.00 |
3/1,0,0,0
|
1000/S
|
1952/ASR
|
10/24/2019
|
|
SR19198200
|
SFR/D
|
25925 | Matfield DR | $825,000 | $662.12 |
3/2,0,0,0
|
1246/A
|
1955/ASR
|
10/29/2019
|
|
PW19153062
|
SFR/D
|
3507 | Cricklewood ST | $845,000 | $549.06 |
3/2,0,0,0
|
1539/A
|
1951/ASR
|
10/11/2019
|
|
SB19214307
|
SFR/D
|
24238 | Neece AVE | $1,200,000 | $424.03 |
4/2,1,0,0
|
2830/A
|
1972/ASR
|
10/30/2019
|
|
SB19180965
|
CONDO/A
|
2940 W | Carson ST #217 | $373,000 | $466.25 |
2/1,0,0,0
|
800/A
|
1962/ASR
|
10/2/2019
|
|
SB19189544
|
CONDO/A
|
1745 | Maple AVE #49 | $430,000 | $494.25 |
2/1,0,0,0
|
870/A
|
1963/ASR
|
10/7/2019
|
|
SB19086985
|
COOP/A
|
3210 | Merrill DR #1 | $435,000 | $321.03 |
2/1,1,0,0
|
1355/SEE
|
1963/EST
|
10/24/2019
|
|
PW19177617
|
CONDO/A
|
2940 W | Carson ST #234 | $445,000 | $438.42 |
2/1,1,0,0
|
1015/A
|
1962/ASR
|
10/31/2019
|
|
SB19147761
|
CONDO/A
|
2571 | Plaza Del Amo #111 | $495,000 | $568.97 |
1/1,0,1,0
|
870/A
|
1985/ASR
|
10/11/2019
|
|
SB19234240
|
TWNHS/A
|
2615 | Plaza Del Amo #638 | $709,000 | $464.61 |
2/2,0,1,0
|
1526/A
|
1987/ASR
|
10/30/2019
|
|
SB19194958
|
TWNHS/A
|
2595 | Plaza Del Amo #418 | $710,000 | $458.36 |
3/2,0,1,0
|
1549/A
|
1986/ASR
|
10/8/2019
|
|
SB19203892
|
TWNHS/A
|
2801 | Sepulveda BLVD #53 | $799,000 | $397.71 |
3/3,0,0,0
|
2009/A
|
1994/ASR
|
10/4/2019
|
|
PV19114928
|
TWNHS/A
|
2801 | Sepulveda BLVD #123 | $802,000 | $424.56 |
3/2,0,1,0
|
1889/A
|
1996/ASR
|
10/9/2019
|
|
SB19115779
|
SFR/D
|
1203 | TERI AVE | $817,000 | $458.99 |
4/3,0,0,0
|
1780/O
|
1951/ASR
|
10/2/2019
|
|
SB19177405
|
TWNHS/A
|
2801 | Sepulveda BLVD #56 | $820,000 | $434.09 |
3/2,0,1,0
|
1889/A
|
1994/ASR
|
10/17/2019
|
|
SB19221274
|
SFR/D
|
1317 | Greenwood AVE | $885,000 | $615.01 |
3/2,0,0,0
|
1439/A
|
1945/ASR
|
10/29/2019
|
|
SB19217237
|
SFR/D
|
826 | Teri AVE | $885,000 | $671.98 |
3/1,1,0,0
|
1317/A
|
1951/ASR
|
10/22/2019
|
|
PV19133608
|
CONDO/A
|
24410 | Crenshaw BLVD #312 | $295,000 | $397.04 |
1/1,0,0,0
|
743/A
|
1987/PUB
|
10/25/2019
|
|
19493760
|
CONDO
|
23026 | NADINE CIR #A | $427,000 | $382.27 |
2/2,0,0,0
|
1117/
|
1963/ASR
|
10/1/2019
|
|
PV19170904
|
CONDO/A
|
22732 | Nadine CIR #A | $485,000 | $510.53 |
2/1,0,1,0
|
950/A
|
1963/ASR
|
10/4/2019
|
|
PW19190782
|
CONDO/A
|
22935 | Maple AVE #B | $530,000 | $474.49 |
1/2,0,0,0
|
1117/A
|
1963/ASR
|
10/25/2019
|
|
PW19162631
|
SFR/D
|
2325 W | 235th ST | $800,000 | $412.80 |
3/3,0,0,0
|
1938/A
|
1958/PUB
|
10/21/2019
|
|
SB19169218
|
SFR/A
|
22703 | Eastwood ST | $860,000 | $567.66 |
3/2,0,0,0
|
1515/A
|
1954/ASR
|
10/4/2019
|
|
SB19185069
|
SFR/D
|
2707 W | 232nd ST | $1,020,000 | $424.29 |
4/3,0,0,0
|
2404/A
|
1965/ASR
|
10/31/2019
|
|
SB19191589
|
SFR/D
|
3414 W | 228th ST | $1,072,000 | $521.65 |
4/3,0,0,0
|
2055/A
|
1954/ASR
|
10/4/2019
|
|
SB19217438
|
SFR/D
|
22622 | Juniper AVE | $1,380,000 | $517.24 |
5/1,2,0,0
|
2668/P
|
1963/PUB
|
10/25/2019
|
|
SB19224613
|
SFR/D
|
4414 | Highgrove | $820,000 | $676.57 |
3/1,0,1,0
|
1212/A
|
1954/ASR
|
10/11/2019
|
|
IN19202984
|
SFR/D
|
4914 | Pacific Coast | $850,000 | $750.88 |
3/1,0,1,0
|
1132/A
|
1953/SEE
|
10/25/2019
|
|
SB19130538
|
SFR/D
|
3898 | Newton ST | $965,000 | $599.01 |
3/1,1,0,0
|
1611/A
|
1940/ASR
|
10/4/2019
|
|
PV19216333
|
SFR/D
|
23705 | Susana AVE | $1,105,000 | $865.99 |
3/1,0,1,0
|
1276/A
|
1954/ASR
|
10/22/2019
|
|
SB19177109
|
SFR/D
|
5002 | Paseo De Las Tortugas | $1,177,500 | $595.30 |
3/2,0,0,0
|
1978/A
|
1956/ASR
|
10/18/2019
|
|
PV19188809
|
SFR/D
|
22920 | Galva AVE | $748,000 | $434.13 |
3/1,2,0,0
|
1723/A
|
1955/ASR
|
10/7/2019
|
|
SB19180228
|
SFR/D
|
5206 | Vanderhill RD | $785,000 | $1,060.81 |
2/1,0,0,0
|
740/A
|
1949/ASR
|
10/25/2019
|
|
SB19143134
|
SFR/D
|
22430 | Susana AVE | $800,000 | $738.01 |
3/1,1,0,0
|
1084/P
|
1952/ASR
|
10/11/2019
|
|
SB19180239
|
SFR/D
|
4528 W | 231st ST | $830,250 | $728.29 |
3/1,0,0,0
|
1140/A
|
1954/ASR
|
10/29/2019
|
|
SB19220642
|
SFR/D
|
4615 | Moresby DR | $1,068,999 | $753.88 |
3/2,0,0,0
|
1418/A
|
1951/ASR
|
10/29/2019
|
|
SB19200665
|
SFR/D
|
5444 | Sharynne LN | $1,400,000 | $1,136.36 |
3/1,1,0,0
|
1232/A
|
1947/ASR
|
10/28/2019
|
|
SB19199638
|
SFR/D
|
23107 | Audrey AVE | $1,430,000 | $386.90 |
4/4,0,1,0
|
3696/A
|
1990/ASR
|
10/29/2019
|
|
SB18284079
|
CONDO/A
|
5500 | Torrance BLVD #A108 | $670,000 | $484.45 |
3/2,0,0,0
|
1383/A
|
1990/ASR
|
10/3/2019
|
|
SB19169552
|
SFR/D
|
21217 | Palos Verdes BLVD | $790,000 | $679.86 |
3/1,1,0,0
|
1162/A
|
1955/ASR
|
10/30/2019
|
|
SB19105054
|
SFR/D
|
4001 | Sepulveda BLVD | $799,900 | $701.67 |
3/2,0,0,0
|
1140/A
|
1956/ASR
|
10/25/2019
|
|
SB19189458
|
SFR/D
|
21921 | Grant AVE | $885,000 | $776.32 |
3/1,1,0,0
|
1140/A
|
1956/PUB
|
10/21/2019
|
|
SB19206659
|
SFR/D
|
4701 | Laurette ST | $990,000 | $660.00 |
3/1,1,0,0
|
1500/A
|
1955/ASR
|
10/8/2019
|
|
SB19240522
|
SFR/D
|
4735 | Narrot ST | $650,000 | $580.36 |
3/1,0,0,0
|
1120/A
|
1954/ASR
|
10/10/2019
|
|
PW19163708
|
SFR/D
|
20004 | Mansel AVE | $805,000 | $551.37 |
3/1,0,1,0
|
1460/A
|
1955/ASR
|
10/16/2019
|
|
SB19211243
|
TWNHS/A
|
3538 | Torrance BLVD #155 | $810,000 | $456.85 |
3/3,0,0,0
|
1773/A
|
2005/PUB
|
10/22/2019
|
|
SB19191693
|
SFR/D
|
4702 W | 191st ST | $825,000 | $751.37 |
3/1,0,0,0
|
1098/A
|
1954/ASR
|
10/7/2019
|
|
SB19187260
|
SFR/D
|
20111 | Hawthorne BLVD | $870,000 | $780.27 |
3/2,0,0,0
|
1115/A
|
1954/PUB
|
10/28/2019
|
|
SB19210520
|
SFR/D
|
19417 | Beckworth AVE | $940,000 | $849.91 |
3/1,1,0,0
|
1106/A
|
1954/ASR
|
10/11/2019
|
|
SB19144303
|
SFR/D
|
20617 | Tomlee AVE | $1,150,000 | $793.10 |
3/2,0,0,0
|
1450/S
|
1959/ASR
|
10/29/2019
|
|
SB19151794
|
SFR/D
|
5532 | Lorna ST | $1,250,000 | $466.59 |
4/3,0,0,0
|
2679/A
|
1993/ASR
|
10/8/2019
|
|
PV19108430
|
SFR/D
|
21018 | Wendy | $1,425,000 | $419.61 |
4/3,0,1,0
|
3396/A
|
1996/ASR
|
10/24/2019
|
|
SB19203693
|
TWNHS/A
|
3743 | Artesia BLVD | $515,000 | $530.93 |
2/2,0,0,0
|
970/A
|
1981/ASR
|
10/28/2019
|
|
PW19184607
|
SFR/D
|
3717 W | 181st ST | $680,000 | $611.51 |
3/1,0,0,0
|
1112/A
|
1953/ASR
|
10/8/2019
|
|
SB19200720
|
SFR/D
|
4335 W | 177th ST | $695,000 | $623.88 |
3/1,0,1,0
|
1114/A
|
1952/PUB
|
10/18/2019
|
|
SB19194006
|
SFR/D
|
3206 W | 179th ST | $731,000 | $546.75 |
3/2,0,0,0
|
1337/A
|
1955/ASR
|
10/9/2019
|
|
SB19193684
|
SFR/D
|
3410 W | 171st ST | $745,000 | $537.13 |
3/1,1,0,0
|
1387/A
|
1953/ASR
|
10/8/2019
|
|
SB19198298
|
SFR/D
|
18304 | Ermanita AVE | $750,000 | $645.44 |
3/2,0,0,0
|
1162/A
|
1956/ASR
|
10/9/2019
|
|
SB19214693
|
SFR/D
|
17519 | Delia AVE | $760,000 | $512.82 |
4/1,1,0,0
|
1482/A
|
1951/ASR
|
10/25/2019
|
|
SB19210036
|
SFR/D
|
3420 W | 185th ST | $771,000 | $597.67 |
3/2,0,0,0
|
1290/E
|
1954/ASR
|
10/25/2019
|
|
PV19206502
|
SFR/D
|
3123 W | 180th ST | $775,000 | $479.58 |
3/1,1,0,0
|
1616/A
|
1955/ASR
|
10/3/2019
|
|
SB19177906
|
SFR/D
|
18628 | Prairie AVE | $800,000 | $511.51 |
3/1,1,0,0
|
1564/A
|
1961/ASR
|
10/11/2019
|
|
SB19200909
|
SFR/D
|
17227 | Wilkie AVE | $620,000 | $732.00 |
2/1,0,0,0
|
847/A
|
1948/ASR
|
10/16/2019
|
|
SB19220898
|
SFR/D
|
16914 | Purche AVE | $683,725 | $549.62 |
3/1,1,0,0
|
1244/A
|
1957/ASR
|
10/11/2019
|
|
SB19208688
|
SFR/D
|
17204 | Haas AVE | $725,000 | $631.53 |
3/1,1,0,0
|
1148/A
|
1954/ASR
|
10/11/2019
|
|
SB19222738
|
SFR/D
|
17030 | Wilkie AVE | $785,000 | $524.38 |
3/2,0,0,0
|
1497/A
|
1948/ASR
|
10/29/2019
|
|
SB19180318
|
SFR/D
|
18304 | Taylor CT | $860,000 | $417.68 |
3/2,0,1,0
|
2059/A
|
1962/ASR
|
10/23/2019
|
|
SB19175388
|
CONDO/A
|
1211 | Cabrillo AVE #303 | $270,000 | $482.14 |
1/1,0,0,0
|
560/A
|
1993/ASR
|
10/2/2019
|
|
SB19136017
|
CONDO/A
|
2700 | Arlington AVE #103 | $480,000 | $380.35 |
2/2,0,0,0
|
1262/A
|
1982/ASR
|
10/21/2019
|
|
SB19197906
|
CONDO/A
|
2367 | Jefferson ST #220 | $590,000 | $467.88 |
2/2,0,0,0
|
1261/A
|
2007/ASR
|
10/18/2019
|
|
SB19195932
|
SFR/D
|
650 | Border AVE | $619,000 | $726.53 |
2/1,0,0,0
|
852/A
|
1925/ASR
|
10/3/2019
|
|
PW19224153
|
TWNHS/A
|
1800 | Oak ST #501 | $847,800 | $432.55 |
3/3,0,0,0
|
1960/A
|
2007/ASR
|
10/17/2019
|
|
19511466
|
TWNHS
|
1800 | OAK ST #407 | $873,000 | $447.69 |
3/3,0,0,0
|
1950/A
|
2007/ASR
|
10/28/2019
|
|
SB19177792
|
SFR/D
|
2314 W | 229th PL | $677,250 | $357.77 |
3/2,0,0,0
|
1893/A
|
1972/ASR
|
10/15/2019
|
|
SB19207271
|
SFR/D
|
2445 W | 236th PL | $730,000 | $790.04 |
3/1,0,0,0
|
924/A
|
1954/ASR
|
10/28/2019
|
|
SB19216681
|
SFR/D
|
23038 | Huber AVE | $741,000 | $644.35 |
3/2,0,0,0
|
1150/A
|
1948/ASR
|
10/18/2019
|
|
SB19212999
|
SFR/D
|
2076 W | 236th ST | $750,000 | $637.76 |
3/1,0,0,0
|
1176/A
|
1924/PUB
|
10/8/2019
|
|
319003532
|
SFR/D
|
2436 W | 239th ST | $760,000 | $608.49 |
3/2,0,0,0
|
1249/A
|
1961/ASR
|
10/16/2019
|
|
SB19120203
|
SFR/D
|
2049 W | 235th ST | $800,000 | $454.29 |
5/2,0,0,0
|
1761/A
|
1965/ASR
|
10/23/2019
|
|
SB19186387
|
SFR/D
|
2057 W | 230th ST | $838,000 | $494.69 |
4/2,0,0,0
|
1694/A
|
1960/ASR
|
10/4/2019
|
|
SB19138198
|
SFR/D
|
2445 W | 230th PL | $870,000 | $443.88 |
4/2,0,0,0
|
1960/A
|
1963/ASR
|
10/10/2019
|
|
SB19208761
|
SFR/D
|
2420 | 231st ST | $950,000 | $502.38 |
4/1,1,0,0
|
1891/A
|
1973/ASR
|
10/30/2019
|
|
SB19154461
|
SFR/D
|
2255 W | 230th ST | $1,200,000 | $286.94 |
4/4,0,0,0
|
4182/A
|
1988/ASR
|
10/1/2019
|
|
PV19240067
|
SFR/D
|
1810 W | 236th ST | $1,255,000 | $342.80 |
5/4,0,0,0
|
3661/A
|
2004/ASR
|
10/29/2019
|
|
PW19159063
|
TWNHS/A
|
1845 | Plaza Del Amo #C | $620,000 | $552.58 |
2/2,0,1,0
|
1122/A
|
1991/EST
|
10/25/2019
|
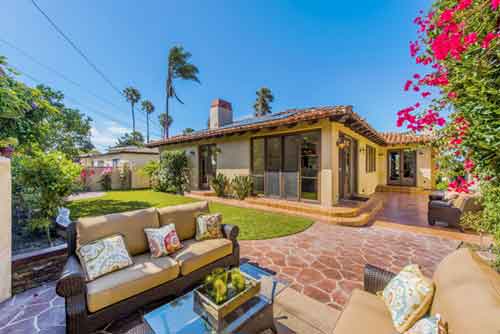 single family homes. The median list price for the closed sales was $1,200,000 with the median sales price of $1,177,500 indicating that it is still a solid seller’s market. That does seem to be shifting somewhat with the playing field leveling just a bit. The least expensive home sale during October was $820,000 for a 3 bedroom, 2 1/2 bath single family home at 4414 Highgrove and the most expenseive sale of the month was a Louis Tomaro designed home at
 Torrance that are similar there is no concentration of these single family, townhome and condo communities anywhere else. It’s really a real estate market unto itself in the heart of Torrance.