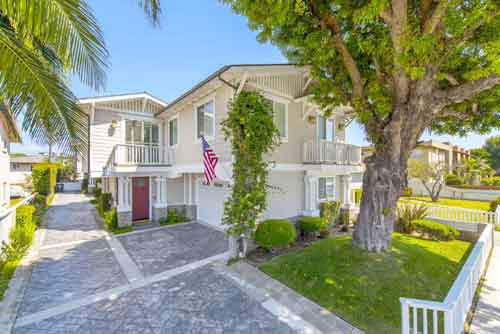
Torrance Home Sales in January 2015
Torrance saw a relatively low number of homes sold in January with 63 homes, condos and townhomes closing 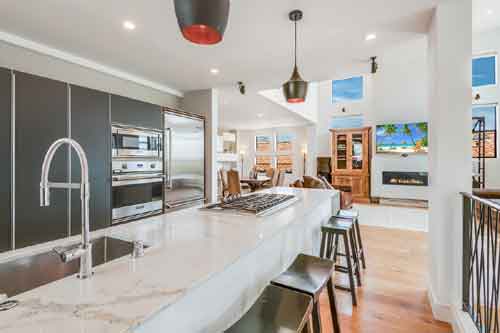 escrow during the month (see Torrance real estate trends and market updates). According to Torrance realtor Keith Kyle, “It’s not unusual to see a significant slowdown of closed home sales during January, as December is a very limited month for new listings and homes entering escrow. With the holidays very little activity happens in the last 3rd of the month meaning far fewer closings in January. Click here to view the home sales in Torrance, and other South Bay cities per month.
| 14808447 | SFR/D | 1600 W | 220TH ST | $ 470,000 | 3/2,0,0,0 | 1944 | 1684 | 54/54 |
| SB14205504 | CONDO/A | 22214 S | Vermont AV #202A | $ 220,000 | 1/1,0,0,0 | 1986/ASR | 711/A | 43/754 |
| SB14185441 | CONDO/A | 817 W | 232nd ST #B | $ 239,500 | 2/2,0,0,0 | 1973/ASR | 842/A | 99/99 |
| SB14209174 | CONDO/A | 800 | Coriander DR #P | $ 252,000 | 2/2,0,0,0 | 1973/ASR | 829/A | 66/66 |
| WS14148838 | TWNHS/A | 22919 | Mariposa AV #802 | $ 393,000 | 3/3,0,0,0 | 2009/ASR | 1380/A | 137/137 |
| SB14249560 | SFR/D | 22819 | Doble AV | $ 410,000 | 3/1,0,0,0 | 1953/ASR | 964/A | 58/58 |
| 14812941 | CONDO/D | 1055 | PARK CIRCLE DR | $ 455,000 | 4/3,0,0,0 | 1984 | 1780 | 27/27 |
| PV14191018 | TWNHS/A | 1613 W | 224th ST #1 | $ 479,000 | 3/2,0,1,0 | 2011/ASR | 2142/A | 43/43 |
| SB14239996 | SFR/D | 1102 | Greenhedge ST | $ 500,000 | 3/2,0,0,0 | 1953/ASR | 1828/A | 14/14 |
| SB14210049 | SFR/D | 1039 | Gian DR | $ 549,000 | 4/1,1,1,0 | 1977/ASR | 2357/A | 78/78 |
| 14785101 | SFR/D | 1719 W | 239TH ST | $ 480,000 | 3/2,0,0,0 | 1956 | 1296 | 94/94 |
| PV14245268 | SFR/D | 3241 | Cricklewood ST | $ 600,500 | 3/1,0,0,0 | 1950/ASR | 1067/E | 13/13 |
| SB14254678 | SFR/D | 4060 | Newton ST | $ 620,000 | 2/1,0,0,0 | 1948/ASR | 1092/A | 42287 |
| SB14171594 | SFR/D | 2814 | Dalemead ST | $ 775,000 | 4/2,0,0,0 | 1952/ASR | 1715/A | 169/169 |
| PW14247013 | SFR/D | 3256 | Dalemead ST | $ 795,000 | 4/2,0,0,0 | 1950/ASR | 1504/A | 22/22 |
| SB14253220 | SFR/D | 3034 | Softwind WY | $ 820,500 | 3/2,0,1,0 | 1975/ASR | 2043/A | 42350 |
| SB14255024 | SFR/D | 3123 | Carolwood LN | $ 928,000 | 4/2,0,1,0 | 1977/ASR | 2200/A | 42256 |
| PV14245765 | SFR/D | 2835 | Windmill RD | $ 990,000 | 4/3,0,1,0 | 1975/ASR | 2499/A | 44/44 |
| SB14247576 | CONDO/A | 1745 | Maple AV #65 | $ 325,000 | 1/1,0,0,0 | 1963/ASR | 870/A | 62/62 |
| SB14234012 | TWNHS/A | 2800 | Plaza Del Amo #388 | $ 569,000 | 3/2,0,1,0 | 1988/ASR | 1404/A | 54/54 |
| SB14205106 | SFR/D | 1404 | FERN AV | $ 615,000 | 3/2,0,0,0 | 1954/ASR | 1383/A | 79/79 |
| SB14113750 | TWNHS/A | 2300 | Maple AV #162 | $ 635,000 | 3/3,0,0,0 | 1987/SEE | 1738/A | 214/214 |
| SR14249854 | SFR/D | 20328 | Roslin AV | $ 900,000 | 5/3,0,0,0 | 1964/ASR | 2232/A | 17/17 |
| SB14208752 | CONDO/A | 22837 | Nadine CR #B | $ 350,000 | 2/1,0,1,0 | 1963/ASR | 1117/A | 60/60 |
| SW14225333 | SFR/D | 22311 | Avis CT | $ 632,500 | 3/1,0,0,0 | 1954/ASR | 1243/A | 56/56 |
| PV14246552 | SFR/D | 3411 W | 228th ST | $ 720,000 | 3/1,1,0,0 | 1954/ASR | 1211/A | 73/73 |
| SB14220209 | SFR/D | 2704 W | 232nd ST | $ 783,000 | 4/1,1,0,0 | 1965/ASR | 2154/A | 85/85 |
| SB14262209 | SFR/D | 22318 | Osage CT | $ 1,050,000 | 4/3,0,0,0 | 1990/ASR | 3408/A | 19/19 |
| SB14230689 | SFR/D | 23152 | Maple AV | $ 1,090,000 | 4/4,0,0,0 | 2000/ASR | 3088/A | 67/93 |
| SB14254888 | SFR/D | 4614 | Highgrove AV | $ 830,000 | 3/2,0,1,0 | 1954/ASR | 1535/A | 38/38 |
| PV14178737 | SFR/D | 3855 | Paseo De Las Tortugas | $ 1,139,000 | 3/2,0,1,0 | 1969/ASR | 2567/A | 105/105 |
| SB15015036 | SFR/D | 226 | Via La Soledad | $ 1,900,000 | 4/2,1,0,0 | 1954/ASR | 2456/A | 0/0 |
| PV14190272 | CONDO/A | 4036 W | 226th ST | $ 575,000 | 2/2,0,1,0 | 1981/ASR | 1685/A | 97/182 |
| PV14122227 | SFR/D | 5319 | Palos Verdes BL | $ 635,000 | 2/1,0,0,0 | 1952/ASR | 834/A | 108/108 |
| SB14191412 | SFR/D | 23032 | Kent AV | $ 750,000 | 4/1,2,0,0 | 1967/ASR | 2088/A | 42129 |
| PV14242640 | SFR/D | 23530 | Ladeene AV | $ 900,000 | 4/1,1,0,0 | 1962/ASR | 2074/A | 46/46 |
| SB14252741 | SFR/D | 21509 | Scannel AV | $ 860,000 | 5/3,0,0,0 | 1955/ASR | 2346/A | 19/202 |
| SB14250153 | SFR/D | 22014 | Linda DR | $ 995,000 | 5/3,0,0,0 | 1955/ASR | 2446/A | 55/55 |
| SB14245145 | SFR/D | 4511 | Narrot ST | $ 640,000 | 3/1,0,0,0 | 1954/ASR | 1100/A | 42350 |
| SB14197154 | SFR/D | 20125 | Wayne AV | $ 749,000 | 4/1,2,0,0 | 1956/ASR | 1924/A | 132/132 |
| SB15001937 | SFR/D | 20421 | Wayne AV | $ 771,000 | 3/1,1,0,0 | 1959/ASR | 1429/A | 42224 |
| PV14240866 | SFR/D | 20105 | Talisman ST | $ 790,000 | 3/2,0,0,0 | 1955/ASR | 1470 | 54/54 |
| OC14235498 | SFR/D | 4202 | Konya DR | $ 925,000 | 4/3,0,0,0 | 1979/ASR | 2640/A | 68/68 |
| SB14185110 | SFR/D | 3845 West W | 177th ST | $ 490,000 | 4/2,0,0,0 | 1967/ASR | 1773/A | 49/49 |
| EV14208565 | SFR/D | 18111 | AMIE AV | $ 545,000 | 3/1,1,0,0 | 1954/ASR | 1216/A | 100/100 |
| SB14259400 | SFR/D | 4123 W | 184th PL | $ 580,000 | 3/1,0,1,0 | 1955/ASR | 1333/A | 30/30 |
| SB14200618 | SFR/D | 4171 W | 172nd ST | $ 608,000 | 3/1,1,0,0 | 1951/ASR | 1400/E | 120/120 |
| SB14226542 | SFR/D | 18017 | Cordary AV | $ 657,345 | 4/1,1,0,0 | 1966/ASR | 1972/A | 39/39 |
| SB14251552 | SFR/D | 2134 W | 177th | $ 489,000 | 3/1,0,0,0 | 1953/ASR | 1073/A | 32/32 |
| SB14245768 | SFR/D | 2714 W | 179TH ST | $ 545,000 | 3/1,1,0,0 | 1953/ASR | 1364/A | 42319 |
| SB14232452 | SFR/D | 16618 | Kristin AV | $ 583,000 | 4/1,1,0,0 | 1955/ASR | 1424/A | 14/14 |
| SB14253246 | SFR/D | 2915 W | 167th ST | $ 600,000 | 3/1,1,0,0 | 1954/ASR | 1356/A | 27/27 |
| SB14243606 | SFR/D | 18819 | Haas AV | $ 629,000 | 3/3,0,0,0 | 1951/ASR | 1756/A | 25/200 |
| SB14126888 | SFR/D | 2415 | Cabrillo AV | $ 480,000 | 2/1,0,0,0 | 1942/ASR | 854/A | 139/139 |
| SB14177699 | CONDO/A | 2349 | Jefferson ST #117 | $ 581,000 | 2/2,0,0,0 | 2008/ASR | 1530 | 91/91 |
| SB14253676 | TWNHS/D | 810 | Amapola AV | $ 590,000 | 3/2,0,1,0 | 2002/ASR | 1711/A | 49/49 |
| SB14237183 | TWNHS/A | 1800 | Oak ST #516 | $ 676,000 | 3/2,0,1,0 | 2007/ASR | 1950/A | 58/58 |
| 14793225 | SFR/D | 23014 | HUBER AV | $ 570,000 | 3/2,0,0,0 | 1948 | 1684/A | 119/119 |
| SB14203890 | SFR/D | 2113 W | 237th ST | $ 675,000 | 3/2,0,0,0 | 1952/ASR | 2042/AP | 78/78 |
| AR14233945 | SFR/D | 2018 W | 238th ST | $ 700,500 | 4/2,0,0,0 | 1976/ASR | 1836/A | 88/88 |
| SB14243119 | SFR/D | 2355 W | 239th ST | $ 759,000 | 4/2,1,0,0 | 2001/ASR | 2762/A | 75/75 |
| PW14243072 | CONDO/A | 838 | Coriander DR #A | $ 225,000 | 1/1,0,0,0 | 1973/ASR | 639/A | 42319 |

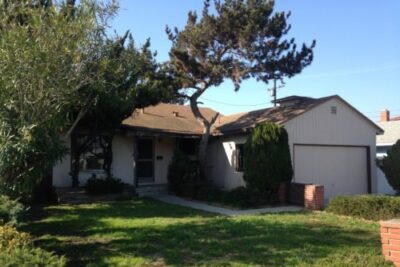
 extensive work but has some great bones and it’s in an ideal location. The price probably eliminates all but the most daring flippers as it probably needs additional square footage and a master bath, but it seems an ideal fit for the owner user that wants to do the rehab work themselves. Other than the bathroom… a coat of paint, refinishing of the hardwood floors (from what we could see they were in great shape under the carpet) and lots of cosmetic love would go a very long way in making the home livable.