
October 2017 Torrance and South Bay Home Sales
October 2017 was a big month for home sales in Torrance with 127 closed sales. Median home prices through all of Torrance CA was $675,000 which was slightly under 7% gain over October 2016. The Torrance market has been extremely busy with prices continuing to rise. The rest of the South Bay saw a mix of year over year increases and decreases. See the Torrance homes that sold in October
| City | Homes Sold | October 2017 Median | October 2016 Median | Year over Year % Change% |
| Carson | 58 | $495,000 | $455,000 | 8.8% |
| El Segundo | 19 | $875,000 | $925,000 | -5.4% |
| Gardena | 43 | $545,000 | $490,000 | 11.2% |
| Harbor City | 17 | $510,000 | $4145,000 | 23% |
| Hawthorne | 50 | $578,000 | $540,000 | 6.9% |
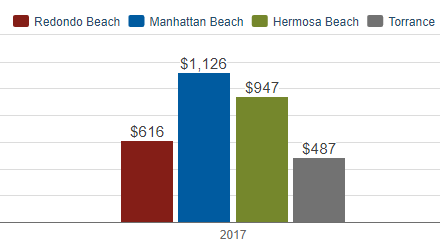
| Hermosa Beach | 21 | $1,414,000 | $2,038,000 | -30.6% |
| Lawndale | 21 | $505,000 | $411,000 | 23% |
| Lomita | 17 | $575,000 | $580,000 | -.9% |
| Long Beach | 322 | $525,000 | $475,000 | 10.5% |
| Manhattan Beach | 28 | $2,875,000 | $2,250,000 | 27.8% |
| Marina Del Rey | 25 | $979,000 | $1,150,000 | 14.9% |
| Palos Verdes Estates | 30 | $1,600,000 | $1,825,000 | -12.3% |
| Play Del Rey | 16 | $665,000 | $635,000 | 4.8% |
| Rancho Palos Verdes | 47 | $1,265,000 | $1,250,000 | 1.2% |
| Redondo Beach | 72 | $1,105,000 | $878,000 | 25.8% |
| San Pedro | 69 | $530,000 | $588,000 | -9.8% |
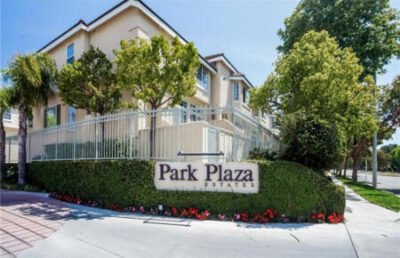
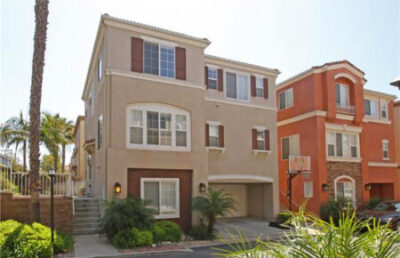
| Torrance | 127 | $675,000 | $632,000 | 6.9% |
| Westchester | 38 | $1,089,000 | $1,050,000 | 3.7% |
 trended up from the previous year in terms of median home prices with only a few local cities seeing a decrease in y over year prices.
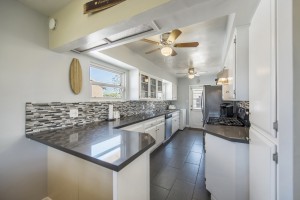 norm but there was really no sense to it with some cities seeing major increases over June of 2016 and some seeing just as major drops in home prices.
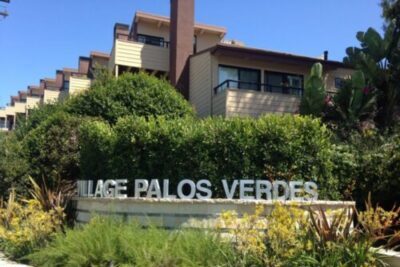
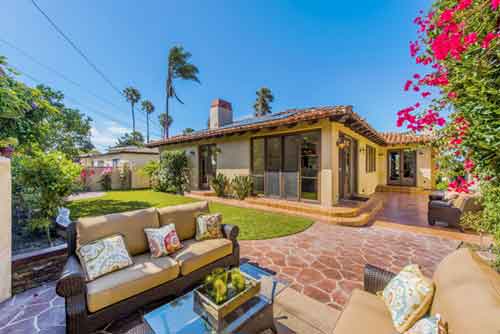
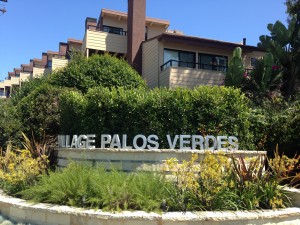 located just south of Palos Verdes drive. Not only do many of the townhomes have great ocean views but the location is ideal with the community just a short walk to Torrance beach and Paseo De La Playa. The complex consists of approximately 180 units with current HOA (as of 8/17) around $480 a month. The street addresses for the homes in Village Palos Verdes are either Calle Mayor, Calle Miramar, Camino De Las Colinas or Palos Verdes Blvd (see map below).