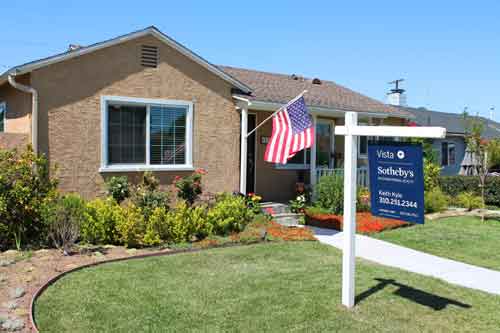
Torrance Real Estate Recap – April 2020 Home Sales & Prices in Torrance CA
April was still a fairly active month for the Torrance CA real estate market. There were 81 home sales for the month which was well below the 99 sold homes from this time a year ago. The median list price for the homes that sold was $789,000 with the median “sold” price of
$779,000 indicating a strong seller’s market. Average price per foot for the month was $515.
View the current homes for sale in Torrance
Home For Sale in April 2020: 102 units.
• Up 24.4% compared to last month
• Down 32% compared to last year
Home Closed in April 2020: 79 units.
• Down 9.2% compared to last month
• Down 20.2% compared to last year
Home Placed under Contract in April 2020: 45 units.
• Down 43% compared to last month
• Down 59.1% compared to last year
April Home Sales and Home Prices for Torrance
|
Type
|
Address |
Price
|
$ Per Foot
|
Bed/Bath
|
Sq Feet
|
Year Built
|
|
|
CONDO/A
|
1614 W
|
207th ST |
$515,000
|
$266.84
|
3/2,0,1,0
|
1930/A
|
2006/ASR
|
|
SFR/D
|
20848
|
Denker Av |
$630,000
|
$690.79
|
2/1,0,0,0
|
912/OTH
|
1954/OTH
|
|
SFR
|
21911
|
NORMAN |
$650,000
|
$527.60
|
2/1,0,0,0
|
1232/
|
1948
|
|
SFR/D
|
1060 W
|
220th ST |
$650,000
|
$435.66
|
4/2,0,0,0
|
1492/A
|
1952/ASR
|
|
SFR/D
|
1326
|
Harmony |
$655,000
|
$324.90
|
4/3,0,0,1
|
2016/A
|
2007/ASR
|
|
SFR/D
|
21223 S
|
Normandie |
$862,990
|
$453.25
|
4/3,0,0,0
|
1904/B
|
2019/BLD
|
|
SFR/A
|
21455 S
|
Normandie AVE |
$916,990
|
$403.78
|
4/3,0,0,0
|
2271/B
|
2019/BLD
|
|
CONDO/A
|
1119
|
Sepulveda BLVD#H202 |
$340,000
|
$427.14
|
2/1,0,0,0
|
796/A
|
1973/ASR
|
|
CONDO/A
|
20516 S
|
Vermont AVE#56 |
$375,000
|
$387.00
|
2/1,1,0,0
|
969/A
|
1978/ASR
|
|
CONDO/A
|
22224 S
|
Vermont AVE#102C |
$435,000
|
$388.39
|
2/2,0,0,0
|
1120/A
|
1985/ASR
|
|
TWNHS/A
|
22533 S
|
Vermont AVE#72 |
$445,000
|
$361.49
|
2/1,0,1,0
|
1231/A
|
1982/ASR
|
|
TWNHS/A
|
22330
|
Harbor Ridge LN #5 |
$505,000
|
$392.39
|
3/1,0,1,0
|
1287/A
|
1980/ASR
|
|
TWNHS/A
|
22326
|
Harbor Ridge LN #2 |
$520,000
|
$353.26
|
3/2,0,1,0
|
1472/A
|
1979/PUB
|
|
TWNHS/A
|
1126 W
|
228th ST |
$549,000
|
$403.08
|
3/2,0,1,0
|
1362/A
|
1988/ASR
|
|
SFR/D
|
801 W
|
213th ST |
$620,000
|
$343.11
|
3/2,0,0,0
|
1807/A
|
1976/ASR
|
|
SFR/D
|
3132
|
Dalemead ST |
$855,000
|
$673.23
|
3/2,0,0,0
|
1270/A
|
1950/ASR
|
|
SFR/D
|
3244
|
Danaha St |
$880,000
|
$767.89
|
3/2,0,0,0
|
1146/A
|
1950/ASR
|
|
SFR/D
|
2643
|
Loftyview DR |
$950,000
|
$627.48
|
3/2,0,0,0
|
1514/A
|
1954/ASR
|
|
SFR/D
|
2634
|
Loftyview DR |
$950,000
|
$583.54
|
3/1,1,0,0
|
1628/A
|
1954/ASR
|
|
SFR/D
|
4134
|
Pacific Coast #134 |
$1,145,000
|
$405.45
|
5/4,0,0,0
|
2824/A
|
2001/ASR
|
|
CONDO/A
|
3030
|
Merrill DR #1 |
$502,800
|
$369.43
|
2/1,1,0,0
|
1361/T
|
1963/ASR
|
|
COOP/A
|
3205
|
Merrill DR #20 |
$525,000
|
$388.89
|
3/1,1,0,0
|
1350/E
|
1963/ASR
|
|
TWNHS/A
|
1704
|
Elm AVE #23 |
$690,000
|
$357.14
|
3/2,0,1,0
|
1932/E
|
1981/ASR
|
|
TWNHS/A
|
2931
|
Plaza Del #22 |
$715,000
|
$525.35
|
2/2,0,1,0
|
1361/A
|
1985/ASR
|
|
TWNHS/A
|
2595
|
Plaza Del #419 |
$745,000
|
$480.96
|
3/3,0,0,0
|
1549/A
|
1986/ASR
|
|
TWNHS/A
|
2300
|
Maple AVE #178 |
$750,000
|
$431.53
|
3/3,0,0,0
|
1738/A
|
1988/ASR
|
|
CONDO/A
|
3538
|
Torrance #192 |
$776,000
|
$466.07
|
3/2,0,1,0
|
1665/A
|
2005/ASR
|
|
TWNHS/D
|
2785
|
Maricopa |
$939,000
|
$373.81
|
4/3,0,0,0
|
2512/A
|
2005/ASR
|
|
SFR/D
|
2116
|
Bridgeport Way |
$1,000,000
|
$410.00
|
3/2,0,1,0
|
2439/A
|
1988/ASR
|
|
SFR/D
|
1122
|
Cranbrook Ave |
$1,192,000
|
$430.64
|
6/3,0,1,0
|
2768/A
|
1951/ASR
|
|
CONDO/A
|
24410
|
Crenshaw BLVD #317 |
$315,000
|
$483.87
|
1/1,0,0,0
|
651/A
|
1987/PUB
|
|
CONDO/A
|
22625
|
Nadine CIR#B |
$420,000
|
$376.01
|
2/2,0,0,0
|
1117/A
|
1963/ASR
|
|
CONDO/A
|
23028
|
Nadine CIR#B |
$460,000
|
$411.82
|
2/2,0,0,0
|
1117/A
|
1963/ASR
|
|
SFR/D
|
22632
|
Greenwoo>d AVE |
$865,000
|
$621.41
|
3/2,0,0,0
|
1392/P
|
1960/ASR
|
|
SFR/D
|
2729 W
|
230th ST |
$960,000
|
$597.76
|
3/1,1,0,0
|
1606/A
|
1960/ASR
|
|
SFR/D
|
24707
|
Via Valmonte |
$928,000
|
$623.24
|
2/2,0,0,0
|
1489/P
|
1970/ASR
|
|
SFR/D
|
4818
|
Greenmeadows AVE |
$950,000
|
$538.55
|
4/2,0,0,0
|
1764/A
|
1953/ASR
|
|
SFR/D
|
4709
|
Greenmeadows AVE |
$1,075,000
|
$614.99
|
3/1,1,0,0
|
1748/A
|
1953/ASR
|
|
SFR/D
|
5505
|
Riviera Way |
$2,225,000
|
$646.80
|
4/4,0,0,0
|
3440/B
|
2019/BLD
|
|
CONDO/A
|
22218 S
|
Vermont Ave#102C |
$430,000
|
$383.93
|
2/2,0,0,0
|
1120/A
|
1985/ASR
|
|
SFR/D
|
4210
|
Cathann St |
$949,000
|
$623.52
|
3/2,0,0,0
|
1522/A
|
1956/ASR
|
|
CONDO/A
|
5500
|
Torrance #C121 |
$660,000
|
$516.03
|
3/2,0,0,0
|
1279/A
|
1990/ASR
|
|
SFR/D
|
21806
|
Anza AVE |
$849,000
|
$744.74
|
3/1,1,0,0
|
1140/A
|
1956/ASR
|
|
SFR/D
|
4710
|
Scott ST |
$900,000
|
$765.96
|
3/1,1,0,0
|
1175/A
|
1955/ASR
|
|
CONDO/A
|
5500
|
Torrance Blvd #A309 |
$685,000
|
$495.30
|
3/2,0,0,0
|
1383/A
|
1990/ASR
|
|
SFR/D
|
19609
|
Talisman St |
$860,000
|
$575.64
|
3/2,0,0,0
|
1494/A
|
1954/ASR
|
|
SFR/D
|
4810
|
Carmelynn |
$865,000
|
$596.55
|
3/1,0,0,0
|
1450/S
|
1955/ASR
|
|
TWNHS/A
|
4410
|
Emerald ST#46 |
$899,999
|
$395.26
|
3/1,1,1,0
|
2277/P
|
1981/PUB
|
|
SFR/D
|
4520
|
Darien ST |
$946,900
|
$862.39
|
3/1,0,0,0
|
1098/A
|
1954/ASR
|
|
SFR/D
|
5214
|
Arvada ST |
$965,000
|
$861.61
|
3/1,1,0,0
|
1120/A
|
1954/PUB
|
|
SFR/D
|
19516
|
Ronald AV |
$965,000
|
$835.50
|
3/1,1,0,0
|
1155/A
|
1956/ASR
|
|
SFR/D
|
19309
|
Donora AV |
$1,015,000
|
$686.27
|
3/2,0,1,0
|
1479/A
|
1955/ASR
|
|
SFR/D
|
19715
|
Redbeam |
$1,125,000
|
$674.87
|
3/2,0,0,0
|
1667/A
|
1969/ASR
|
|
SFR/D
|
5602
|
Marialinda |
$1,180,000
|
$737.50
|
3/2,0,0,0
|
1600/S
|
1959/ASR
|
|
SFR/D
|
5609
|
Marialinda |
$1,200,000
|
$650.05
|
4/2,0,0,0
|
1846/A
|
1959/ASR
|
|
SFR/D
|
19202
|
Beckworth Ave |
$1,400,000
|
$590.47
|
4/2,0,0,0
|
2371/A
|
1954/ASR
|
|
SFR/D
|
3418 W
|
172nd ST |
$755,000
|
$516.77
|
3/2,0,0,0
|
1461/A
|
1953/ASR
|
|
SFR/D
|
18929
|
Roselle AV |
$780,000
|
$428.34
|
4/1,2,0,0
|
1821/A
|
1968/ASR
|
|
SFR/D
|
4217 W
|
175th PL |
$860,000
|
$416.87
|
4/2,0,0,0
|
2063/A
|
1976/ASR
|
|
SFR
|
4146 W
|
177TH ST |
$925,000
|
$404.46
|
4/2,0,1,0
|
2287/
|
1952
|
|
TWNHS/A
|
18421
|
Van Ness AVE |
$550,000
|
$416.35
|
3/2,0,1,0
|
1321/A
|
1964/ASR
|
|
TWNHS/A
|
2052
|
Artesia BL #B |
$620,000
|
$371.04
|
3/3,0,0,0
|
1671/A
|
2001/OTH
|
|
SFR/D
|
16010
|
Illinois CT\ |
$750,000
|
$370.92
|
5/3,0,0,0
|
2022/A
|
1950/ASR
|
|
SFR/D
|
2007 W
|
180TH ST 4315 |
$779,000
|
$575.76
|
3/1,1,0,0
|
1353/A
|
1957/ASR
|
|
SFR/D
|
2615 W
|
166th PL W |
$835,000
|
$642.31
|
3/1,1,0,0
|
1300/A
|
1955/ASR
|
|
SFR/D
|
16515
|
Purche AV E |
$850,000
|
$450.69
|
3/2,0,1,0
|
1886/A
|
1955/ASR
|
|
SFR/D
|
16923
|
Cranbrook |
$885,000
|
$441.84
|
4/2,0,0,0
|
2003/A
|
1956/ASR
|
|
TWNHS
|
1262
|
ENGRACIA AVE |
$590,000
|
$671.98
|
2/1,0,1,0
|
878/
|
2005
|
|
TWNHS/A
|
1956
|
Plaza Del Amo #A |
$618,000
|
$446.85
|
3/3,0,0,0
|
1383/A
|
1987/ASR
|
|
SFR/D
|
2435
|
Cabrillo AVE |
$725,000
|
$620.72
|
3/1,0,0,0
|
1168/A
|
1942/ASR
|
|
TWNHS/D
|
1911
|
Gramercy AVE |
$730,000
|
$507.65
|
3/2,0,0,0
|
1438/A
|
1990/ASR
|
|
CONDO/A
|
759
|
Border AVE |
$750,000
|
$483.87
|
3/2,0,1,0
|
1550/A
|
2005/PUB
|
|
SFR/D
|
2216 W
|
236th PL |
$720,000
|
$549.62
|
4/1,1,0,0
|
1310/A
|
1955/ASR
|
|
SFR/D
|
2826
|
Gramercy AVE |
$765,000
|
$728.57
|
3/2,0,0,0
|
1050/A
|
1947/ASR
|
|
SFR/D
|
2379 W
|
230th ST |
$808,000
|
$481.53
|
3/1,1,1,0
|
1678/A
|
1958/ASR
|
|
SFR/D
|
2350 W
|
228th ST |
$903,000
|
$393.29
|
4/2,1,0,0
|
2296/A
|
1963/ASR
|
|
SFR/D
|
1832 W
|
243rd Pl |
$926,000
|
$493.08
|
4/2,0,0,0
|
1878/A
|
1964/ASR
|
|
SFR/D
|
2228 W
|
231st ST |
$980,000
|
$517.70
|
4/3,0,0,0
|
1893/P
|
1973/PUB
|
|
CONDO/A
|
1528
|
Marcelina AVE #F |
$485,000
|
$575.33
|
2/1,0,0,0
|
843/A
|
1991/ASR
|
|
SFR/D
|
20603
|
Berendo AVE |
$590,000
|
$512.15
|
3/2,0,0,0
|
1152/A
|
1930/PUB
|
|
SFR/D
|
720 W
|
214th ST |
$607,000
|
$404.13
|
3/2,0,0,0
|
1502/A
|
1950/PUB
|