Torrance Home Sales and Median Home Prices for September

September was another busy month in South Bay Real estate with a strong number of home sales along with some impressve prices.  Torrance recorded 126 property sales with a median home price of just under $730,000.  The lowest sale of the month was a sharp 1 bedroom condo on Sepulveda for $269,900 with the high sale of the month being a beautiful 4600 foot single family home in the Seaside Ranchos/Christmas Lights area which sold at $2,400,000.  To see all of the homes sold in the South Bay in September visit our recent home sales page.

City Homes Sold September 2017 Median September 2016 Median Year over Year % Change%
Carson 55 $511,000 $462,000 10.5%
El Segundo 9 $1,130,000 $840,000 34.5%
Gardena 48 $475,000 $444,000 7.1%
Harbor City 22 $553,000 $465,000 19%
Hawthorne 46 $595,000 $558,000 6.6%
HermosaBeach 12 $2,150,000 $1,449,000 48.4%
Lawndale 15 $490,000 $479,000 2.3%
Lomita 12 $576,000 $593,000 -2.9%
Long Beach 326 $520,000 $478,000 8.8%
Manhattan Beach 38 $1,877,000 $2,200,000 -14.7%
Marina Del Rey 24 $933,000 $900,000 3.7%
Palos Verdes Estates 43 $1,600,000 $1,4023,000 14.1%
Playa Del Rey 17 $753,000 $538,000 39.9%
Rancho Palos Verdes 52 $1,250,000 $1,035,000 20.8%
Redondo Beach 86 $1,021,000 $1,035,000 20.8%
San Pedro 71 $558,000 $534,000 4.7%
Torrance 126 $728,000 $648,000 12.4%
Westchester 25 $1,140,000 $890,000 15.2%
Torrance homes for sale sign

2016 Top Producing Realtor Announced in the South Bay

Vista Sotheby’s International, one of the top real estate firms in Torrance and the South Bay area of Los Angeles have recently announced  their “Top Producers” for 2016. With offices throughout the area including Manhattan Beach, Hermosa Beach, Palos Verdes, Redondo Beach and the Hollywood Riviera, Vista Sotheby’s has quickly become the dominant force in the local real estate market.

We are proud to annouce that Torrance real estate specialist Keith Kyle was one of the top agents companywide and was the #9 top producing agent for 2016.   Congrats to all of the realtors given the award.  See also the Vista Sotheby’s top producers for 2015.
Top Realtors in the South Bay 2016

We wanted to thank all of our clients and friends that helped make 2016 such as successful year in real estate.

South Redondo Beach and the Hollywood Riviera

New Real Estate Website for the Hollywood Riviera

We’ve created a new real estate website geared specificially to the Hollywood Riviera area of Torrance. The Hollywood Rivera is one of our favorite areas in all of the South Bay with great views, proximity to the beach, ideal weather, a wonderful neighborhood feel, and somewhat restrictive building codes keeping the homes appropriate for the lot sizes and protecting the views.

To see real estate and homes for sale in the Hollywood Riviera visit out new real estate website.

South Redondo Beach and the Hollywood Riviera

Redondo Beach homes for sale - Ford

Torrance Median Home Prices for February 2016

By Keith KyleTorrance open houses

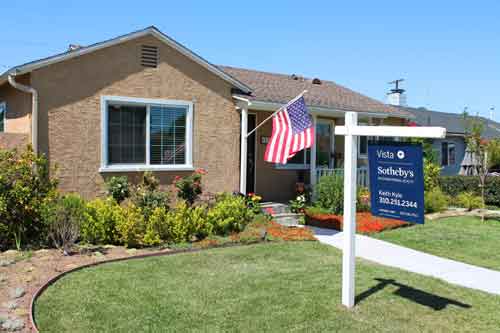
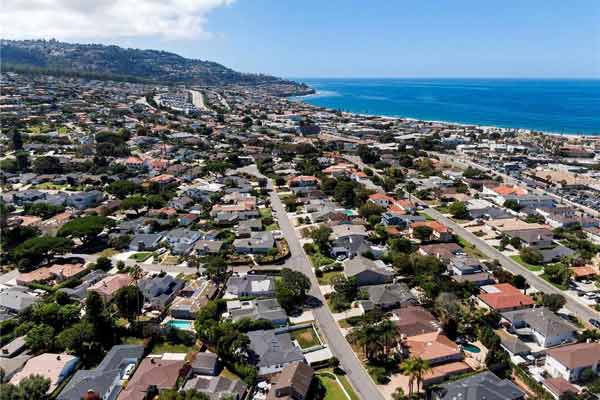
Torrance, CA and the South Bay saw another strong month for home prices although a few cities saw big percentage drops in average home prices.  Those numbers, especially in smaller cities, or in a month with fewer home sales, don’t really mean much, but taken over times gives a good indication as to what is happening in the local Torrance real estate market.

Torrance had a slightly lower than average month with 85 home sales,with median home prices in the mid $500,000’s.

City # of Homes Sold February 2016 Median February 2015 Median Yearover Year % Change%
Carson 38 $420,000 $395,000 6.2%
El Segundo 11 $1,109,000 $815,000 36%
Gardena 38 $410,750 $334,000 23%
Harbor City 10 $527,500 $393,000 34.2%
Hawthorne real estate 30 $483,000 $450,000 7.4%
Hermosa Beach homes 17 $1,225,000 $1,512,500 -19%
Lawndale homes 8 $431,000 $415,000 3.9%
Lomita 11 %505,000 $326,000 55%
Long Beach 238 $461,000 $409,000 12.7%
Manhattan Beach 22 $1,795,000 $2,361,000 -24%
Marina Del Rey 25 $864,000 $1,335,000 -35%
Palos Verdes Estates 33 $1,403,000 $1,300,000 7.9%
Playa Del Rey 10 $626,000 $710,750 6.9%
Rancho Palos Verdes 26 $1,110,000 $1,039,000 6.9%
Redondo Beach 45 $869,750 $812,000 7.1%
San Pedro 33 $505,000 $416,000 21.4%
Torrance 85 $565,000 $544,000 4%
Westchester 21 $917,000 $820,000 11.8%

Torrance Foreclosures Continue to Dwindle

By Keith KyleForeclosure-sign

Torrace continues to see a decline in distressed home sales with only 5 actve short sales and no current bank owned homes or REO listings.  With property values continuing to rise and now that we’re beyond peak prices, the ability for distressed homeowners to sell for a profit (or not at a loss) has limited the foreclosure market to a trickle.  View the current distressed home sales in Torrance CA.  Contact realtor and Torrance specialist Keith Kyle for information on the market or any of the homes below.  To see foreclosures in other South Bay cities, visit our South Bay and Beach cities foreclosures page.

MLS Type   Address Type  Price  Bed/Bath Year
Sq Ft
SB14227234 SFR/D 22925 Alexandria AV SPAY  $ 360,000 3/1,0,0,0 1955/ASR 867/A
PV15199285 CONDO/A 3120 Sepulveda BL #211 FOR, NOD, SPAY  $ 299,000 2/2,0,0,0 2002/EST 727/E
SR15258736 TWNHS/A 4325 W 182nd ST #18 SPAY  $ 449,999 2/2,0,1,0 1980/ASR 1398/A
15933447 TWNHS 18239 VAN NESS AV #301 SPAY  $ 414,000 3/1,1,1,0 1964 1321
SB15017245 SFR/D 1951 W 235th ST SPAY  $ 620,000 3/1,1,0,0 1964/ASR 1575/A
Torrance open houses

Torrance CA Home Prices Continue to Rise in December

By Keith KyleTorrance open houses

The December numbers are in and if there was any thought that the real estate market in Torrance was slowing down or leveling the numbers certainly say otherwise.

The average home price in Torrance for the homes that closed escrow during December was $620,851* with a median price of $619,000*.  Those are big numbers that still shows no sign of slowing or reversing.   See the chart below for the December home sales numbers for Torrance and the South Bay for December of 2015.

*Based on MLS sales only.  Does not include off market sales information

City # of Homes Sold December 2015 Median December 2014 Median Yearover Year % Change
Carson 73 $360,000 $365,000 -1.4%
El Segundo real estate 10 $949,000 $735,000 20.2
Gardena 41 $420,000 $385,000 9.1%
Harbor City 15 $483,000 $467,000 9.1%
Hawthorne real estate 35 $508,500 $667,750 -23.8%
Hermosa Beach 24 $1,475,000 $1,360,000 8.5%
Lawndale real estate 13 $420,000 $415,000 1.2%
Lomita 16 $520,000 $490,000 6.1%
Long Beach 339 $456,000 $395,000 15.4%
Manhattan Beach real estate 34 $2,184,000 $1,689,000 29.3%
Marina Del Rey 31 $905,000 $759,000 19.2%
Palos Verdes Estates 29 $1,456,000 $1,150,000 26.7%
Playa Del Rey 17 $605,000 $482,000 25.5%
Rancho Palos Verdes 48 $1,170,000 $1,135,000 3.1%
Redondo Beach homes 89 $836,250 $770,000 7.3%
San Pedro 72 $517,500 $492,000 5.2%
Torrance 122 $619,000 $562,000 10.1%
Westchester 34 $951,000 $807,500 17.8%