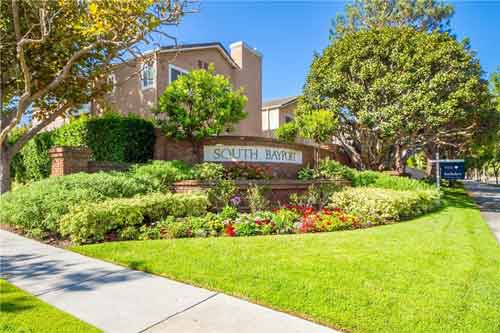
South Bayport in Plaza Del Amo Torrance

Recent Home Sales in The Communities of Plaza Del Amo

Plaza Del Amo is a unique area in Central Torrance with an abundance of gated communities.  Although there are certainly complexes inPlaza Del Amo homesTorrance that are similar there is no concentration of these single family, townhome and condo communities anywhere else.  It’s really a real estate market unto itself in the heart of Torrance.
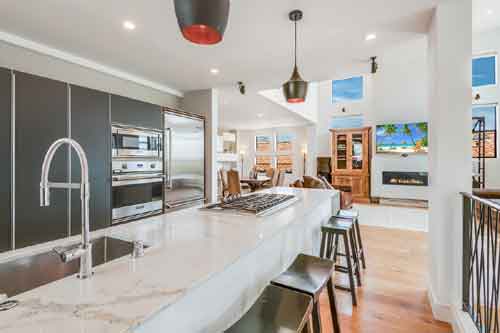
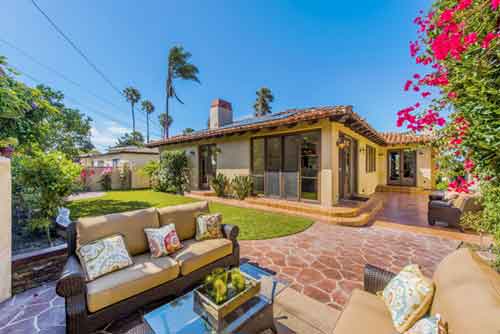
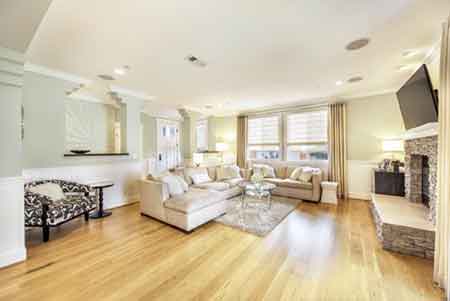
The real estate market in the Plaza Del Amo area was solid once again for the month of August 2019 with 11 closed home sales during the month.  The lowest priced sale of the month was a 1 bedroom condo on Merrill selling at just under $400,000 with the high sale of the months being a 4 bedroom single family home on Cranbrook selling at $895,000.  View also the current homes for sale in the Plaza Del Amo communities of Torrance.

Plaza Del Amo August Home Sales

MLS Type Address Sales Price $ Per Foot Bed/Bath Sq Feet Year Close Date
SB19124068 CONDO/A 2559 Plaza Del Amo #208 $535,000 $508.56 1/1,0,1,0 1052/A 1984/ASR 8/1/2019
PV19116891 TWNHS/A 2800 Plaza Del Amo #239 $620,000 $569.85 2/2,0,1,0 1088/A 1988/ASR 8/2/2019
IV19127812 SFR/D 905 Faysmith AVE $890,000 $540.05 4/2,0,0,0 1648/A 1951/PUB 8/2/2019
SB19142190 TWNHS/A 2801 Sepulveda BLVD #122 $825,000 $455.55 3/2,0,1,0 1811/A 1996/ASR 8/6/2019
SB19150625 SFR/D 1633 Hickory AVE $880,000 $511.93 4/1,0,1,0 1719/A 1948/ASR 8/7/2019
SB19157610 TWNHS/A 2595 Plaza Del Amo #415 $668,000 $491.54 2/2,0,1,0 1359/A 1986/ASR 8/14/2019
PW19114607 SFR/A 1204 Cranbrook AVE $895,000 $473.54 4/2,0,0,0 1890/A 1951/ASR 8/21/2019
SB19181641 SFR/D 1719 Iris AVE $880,000 $451.75 4/2,0,1,0 1948/A 1957/ASR 8/26/2019
SB19163321 TWNHS/A 3101 Plaza Del Amo #23 $635,000 $466.57 2/3,0,0,0 1361/A 1986/ASR 8/29/2019
SB19150903 CONDO/A 3030 Merrill DR #39 $398,000 $457.47 1/1,0,0,0 870/A 1963/ASR 8/30/2019
819003245 SFR/D 1027 Kornblum AVE $809,000 $641.55 3/1,0,1,0 1261/P 1951/ASR 8/30/2019


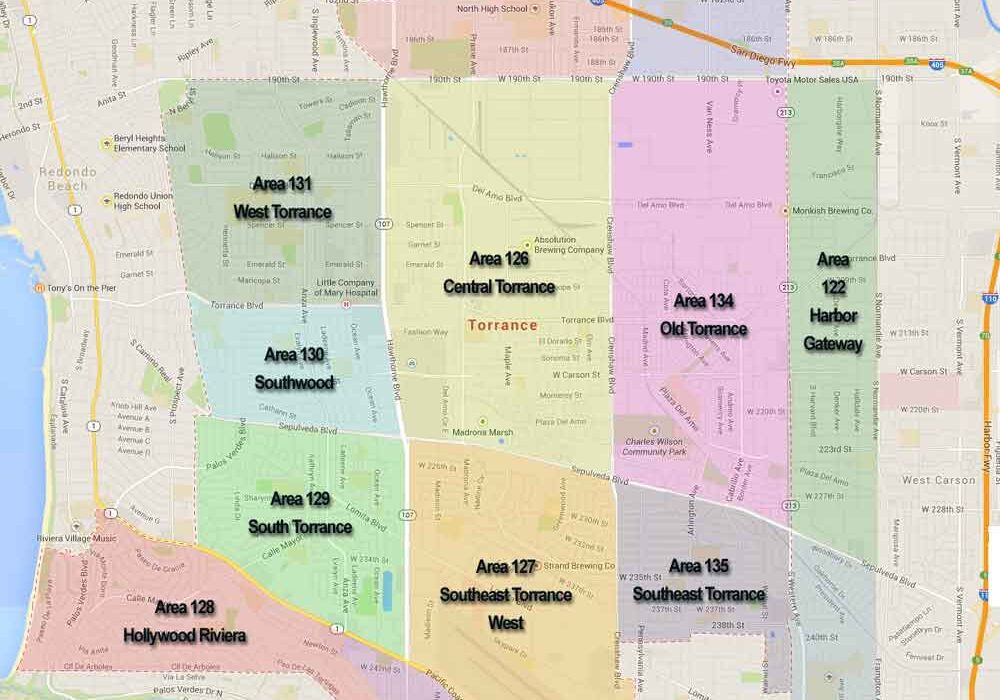
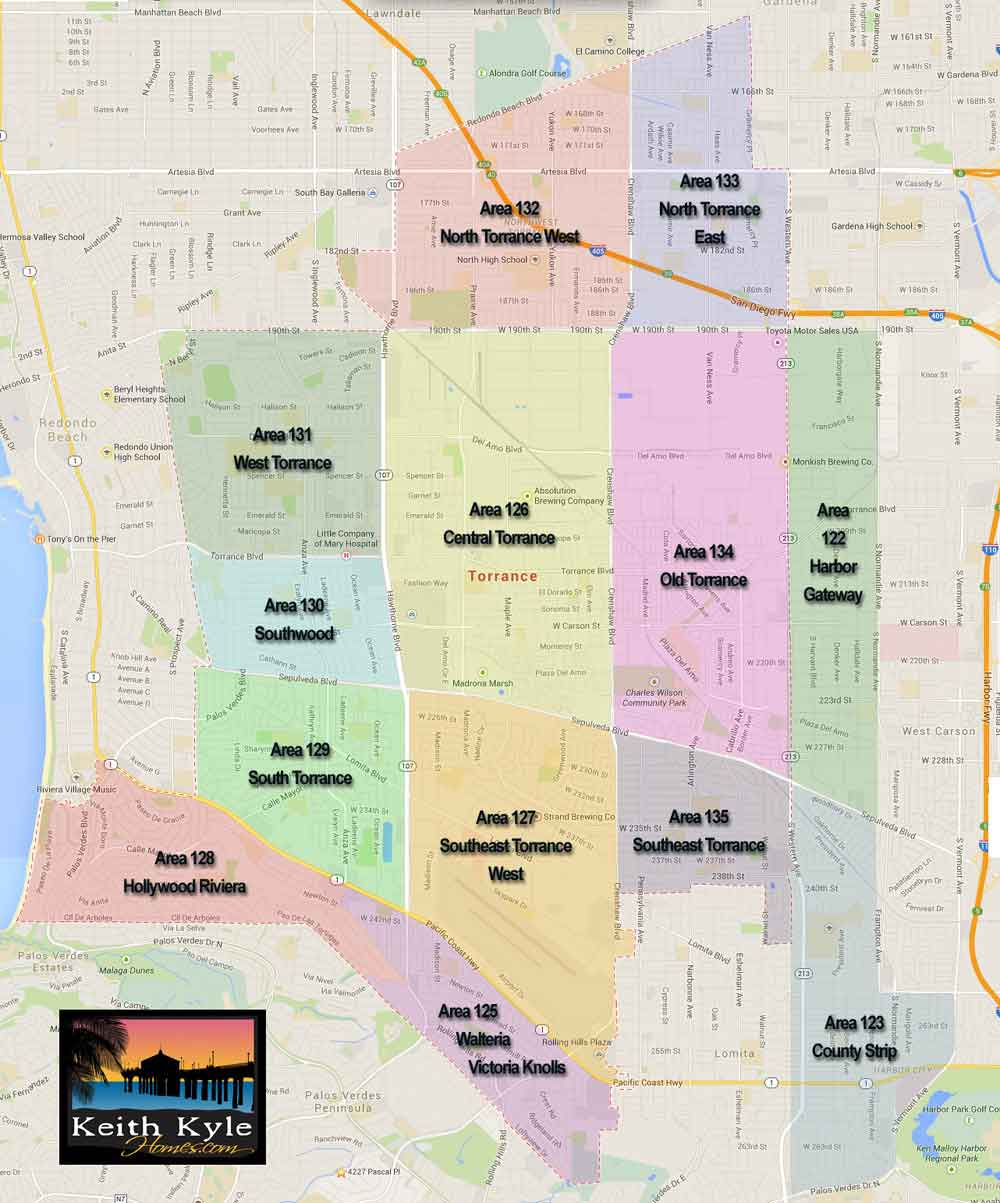
Torrance neighborhood real estate map.

Search Homes for Sale on our Torrance Real Estate Map

Click on any neighborhood below to see the current homes for sale in that area of Torrance. Explore North Torrance, Old Torrance, Plaza Del Amo, Southwood, Hollywood Riviera and more.

Click here to view all of the homes currently or sale in Torrance

Want an even easier way to search for homes?  Tell us just a bit about your ideal home and we’ll customize a home search and send you updates whenever a new listing hit’s the market.  Never miss a Torrance listing again.

The Neighborhoods of Torrance CA

Click on any “area”  below to see the homes currently for sale in that neighborhood.

northtorrance WestTorrance hollywoodriviera Walteria Southwood OldTorrance SouthTorrance SoutheastTorrance CentralTorrance HarborGateway


Torrance neighborhood real estate map.

Search Torrance Homes for Sale by Neighborhood

We hope that our neighborhood search page allows you to focus on just the areas you’re interested in. Torrance has some great neighborhoods and housing options and we hope that searching for specific areas makes that search easier. You can also search for Torrance homes by price range.

Want an easier way? Tell us a bit about your dream home and we’ll customize a search and send you daily listing alerts for homes that match what you’re looking for.

torrance homes for sale
west torrance homes
southwood torrance
hollywood riviera homes
Central Torrance homes for sale
south torrance real estate
walteria torrance homes
north Torrance homes for sale
old torrance homes
south east torrance homes
harbor gateway torrance homes
Plaza Del Amo real estate
south east torrance homes
Single family homes for sale in Torrance
condos and townhomes for sale in Torrance
Torrance duplexes for sale
55+ senior condos in Torrance
Torrance real estate map

Search Neighborhoods on Our Torrance Real Estate Map

North Torrance homes West Torrance homes hollywood riviera homes Walteria Southwood Torrance homes OldT orrance South Torrance homes Southeast Torrance homes Central Torrance homes Harbor Gateway homes
Torrance open houses

Sotheby’s Announces their Top Agents for 2018

 Vista Sotheby’s International Realty, one of the top real estate brokerages for Torrance, Redondo and the entire South Bay, just recently announced their top 25 agents for 2018 . Torrance/Redondo Beach real estate specialist Keith Kyle was named as one of the highest producing realtors for the year.  We are proud to, once again, be named to the list of top producing agents at Vista Sotheby’s International Realty.   We wanted to thank all of our friends and clients for putting their trust in us and hope we can earn your trust as well.

 Sotheby's Top Realtors in the South Bay

Keith has been a full time licensed realtor since 2005 and has been recognized as a “top producer” at both South Bay Brokers and Vista Sotheby’s since 2007. See Keith Kyle’s bio and background information on our about your realtor page.

Torrance Real Estate Recap – 2018 Year in Review

By Keith Kyle

2018 was a banner year for real estate in Torrance CA. Demand was extremely high and prices continued to rise throughout the year with a slight drop towards the winter months which is not unusual.  The number of homes for sale really ramped up after spring from a low of 76 homes on the market in January to a high of 167 homes for sale in July.  There were 1,195 residential “on market” home sales in Torrance for the year.  These statistics do not include the homes in the Hollywood Riviera with Redondo mailing address but actually in Torrance.

Homes Selling At or Above Asking Price

One extremely impressive indicator of just how strong the market remained through the year was the % difference between list price and sold price (how close the sellers were to full asking price).  In seven of the months the average home sold at, or above the average list price and in the remaining 5 months they were within a percent or 2 of full list price.  That’s a sign of an extremely seller friendly market.

See the current homes for sale in Torrance

Days on Market Very Low

Another solid indicator was the average days on market with only topped 30 days once….in January of 2018.  Median prices for the year generally overed between $700,000 and $800,000.

Date January February March April May June July August September October November December
For Sale 76 78 88 111 144 149 167 165 149 164 165 119
New Listing 94 104 121 147 147 163 162 146 110 136 103 59
Sold 59 52 97 95 110 115 131 135 112 112 97 74
Pended 72 86 104 107 113 135 124 136 95 101 85 85
Avg. Active Price  $757.000  $749.000  $815.000  $820.000  $814.000  $780.000  $819.000  $809.000  $ 803.000  $771.000  $727.000  $724.000
Avg. Sold Price  $714.000  $739.000  $709.000  $739.000  $806.000  $747.000  $715.000  $721.000  $765.000  $744.000  $735.000  $766.000
Avg. Sq. Ft. Price (Sold) 488 484 484 483 503 504 482 495 497 469 495 494
Sold/List Diff. % 100 101 102 102 102 101 101 100 100 99 99 100
Sold/Orig LP Diff. % 99 100 101 101 102 101 100 99 100 98 98 98
Avg Days on Market 34 26 22 22 19 20 23 21 25 30 27 29
Median Sold Price 700,000 705,000 690,000 740,000 800,000 732,000 695,000 735,000 743,000 716,000 710,000 758,000