Torrance Real Estate Recap – 2018 Year in Review

By Keith Kyle

2018 was a banner year for real estate in Torrance CA. Demand was extremely high and prices continued to rise throughout the year with a slight drop towards the winter months which is not unusual.  The number of homes for sale really ramped up after spring from a low of 76 homes on the market in January to a high of 167 homes for sale in July.  There were 1,195 residential “on market” home sales in Torrance for the year.  These statistics do not include the homes in the Hollywood Riviera with Redondo mailing address but actually in Torrance.

Homes Selling At or Above Asking Price

One extremely impressive indicator of just how strong the market remained through the year was the % difference between list price and sold price (how close the sellers were to full asking price).  In seven of the months the average home sold at, or above the average list price and in the remaining 5 months they were within a percent or 2 of full list price.  That’s a sign of an extremely seller friendly market.

See the current homes for sale in Torrance

Days on Market Very Low

Another solid indicator was the average days on market with only topped 30 days once….in January of 2018.  Median prices for the year generally overed between $700,000 and $800,000.

Date January February March April May June July August September October November December
For Sale 76 78 88 111 144 149 167 165 149 164 165 119
New Listing 94 104 121 147 147 163 162 146 110 136 103 59
Sold 59 52 97 95 110 115 131 135 112 112 97 74
Pended 72 86 104 107 113 135 124 136 95 101 85 85
Avg. Active Price  $757.000  $749.000  $815.000  $820.000  $814.000  $780.000  $819.000  $809.000  $ 803.000  $771.000  $727.000  $724.000
Avg. Sold Price  $714.000  $739.000  $709.000  $739.000  $806.000  $747.000  $715.000  $721.000  $765.000  $744.000  $735.000  $766.000
Avg. Sq. Ft. Price (Sold) 488 484 484 483 503 504 482 495 497 469 495 494
Sold/List Diff. % 100 101 102 102 102 101 101 100 100 99 99 100
Sold/Orig LP Diff. % 99 100 101 101 102 101 100 99 100 98 98 98
Avg Days on Market 34 26 22 22 19 20 23 21 25 30 27 29
Median Sold Price 700,000 705,000 690,000 740,000 800,000 732,000 695,000 735,000 743,000 716,000 710,000 758,000
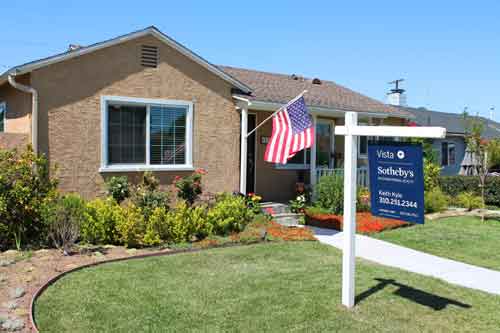
Torrance homes for sale sign

State of the Torrance Real Estate Market Heading into 2019

Torrance Real Estate Trends

**See updated information on 2020 real estate in Torrance Torrance is far more than one uniform real estate market.  With neighborhoods that range from sub $500,000 to homes in the multi millions, each area has it’s own localized market. Visit Torrance Real Estate for more information on the community and market in Torrance CA In general the real estate market seems to be slowing down heading into 2019.  Demand is cooling with higher interest rates and a fairly regular slow down this time of year when people are busy with the holidays.
According to Torrance realtor Keith Kyle, “It’s clear that the market is cooling off as there has been an increase in new listings coupled with fewer sales and homes going into escrow since summer.”  The chart above shows that the number of active listings has held pretty steady between 150 and 170 since summer, but the number of sold homes as well as new escrows has continued to decrease.  If this trend continues the market will shift more in favor of buyers and less in favor of sellers.  It’s clearly been a sellers market over the past few years. The chart below shows the upward trend over the past few months with avarage “months of inventory” of unsold homes on the rise.

How Do Torrance Buyers Choose a Neighborhood

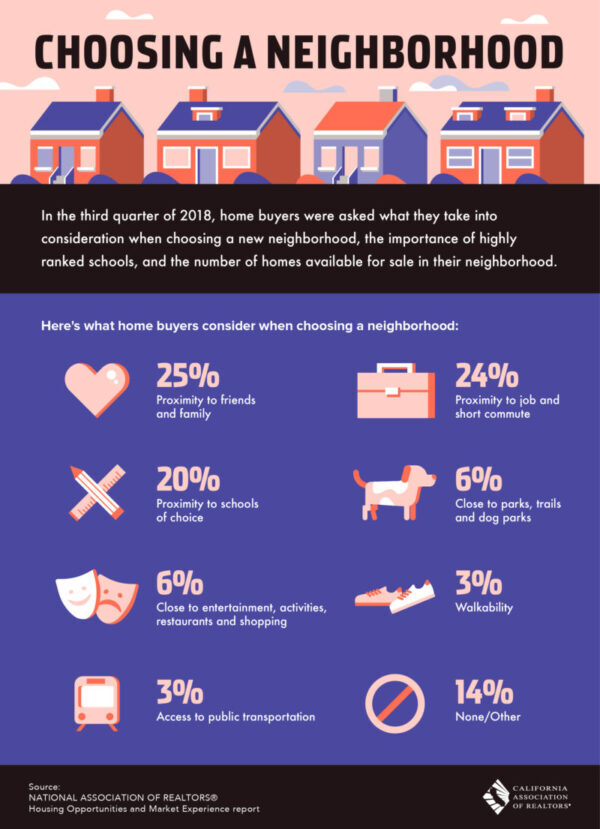
Just as every community is different…..every home buyer is different as well.  A recent survey provided some insight into California home buyers.  See what is important to home buyers in Torrance and CA according to a recent CAR survey.

Here’s some of what home buyers look for when choosing a neighborhood.

  • 25% wanted a home close to friends and family
  • 24% wanted a short commute
  • 20% wanted homes in a specific school district

See the chart below for some other important details when choosing a neighborhood.

How do buyers choose a neighborhood

Torrance California Home Sales for October 2018

October was another solid month for home sales in Torrance with 112 home sales.  The average listing price for the month was $748,206 with the average sales price at $744,270.  The median list price was $729,000 while the median sold price was at $715,875.  The highest sale of the month was $1,750,000 for a 4 bedroom home in South Torrance in the Seaside Ranchos neighborhood at 5006 Sharynne and the lowest priced sale was a condo at $265,000.

See the current homes for sale in Torrance CA

October 2018 Torrance Home Sales

Type
 
Address  Price   $ per foot  Bed/Bath Sq Feet Year Built
SFR/D
1554 W
220th ST  $ 479,000  $    665.28
1/1,0,0,0 720/A 1924/ASR
SFR/D
1626 W
214th ST  $525,000  $    713.32
2/1,0,0,0 736/A 1951/ASR
SFR/D
1456 W
223rd ST  $580,200  $    499.31
3/2,0,0,0 1162/A 1944/ASR
SFR/D
1527 W
213th ST  $585,000  $    565.76
2/2,0,0,0 1034/A 1940/ASR
SFR/A
1306 W
214th ST  $600,000  $   364.08
3/2,0,1,0 1648/A 1959/PUB
CONDO/A
1133
Sepulveda Blvd #202  $340,000  $    427.14
2/1,0,0,0 796/A 1973/ASR
CONDO/A
1127
Sepulveda Blvd #L104  $350,000  $   408.88
2/2,0,0,0 856/A 1973/APP
CONDO/A
20565 S
Vermont AVE #8  $390,000  $   402.89
2/2,0,0,0 968/A 1982/ASR
CONDO/A
23314
Marigold AVE #S101  $425,000  $   398.69
3/2,0,0,0 1066/A 1973/ASR
CONDO/A
22912 S
Vermont AVE #4  $445,000  $    399.82
3/2,0,0,0 1113/A 1973/ASR
CONDO/A
22919
Mariposa AVE #801  $450,000  $    381.36
2/1,1,1,0 1180/A 2009/ASR
CONDO/A
874 W
232nd ST  $475,000  $   348.50
3/2,0,0,0 1363/A 1974/ASR
SFR/D
22922
Doble AVE  $540,000  $    534.65
3/1,0,0,0 1010/A 1953/ASR
SFR/A
22912
Doble AVE  $575,000  $    429.10
4/2,0,0,0 1340/A 1953/ASR
SFR/D
21141
Broadwell AVE  $605,000  $    376.48
3/2,0,0,0 1607/A 1954/ASR
SFR/D
20963 S
Van Deene AVE  $615,000  $    488.10
3/2,0,0,0 1260/A 1957/ASR
SFR/D
808
Gian DR  $649,000  $    409.21
4/2,0,0,0 1586/A 1968/ASR
SFR/D
719 W
226th ST  $651,000  $    269.34
4/3,0,0,0 2417/A 1968/ASR
SFR/D
21430
Marigold AVE  $665,000  $   358.88
3/2,0,0,0 1853/A 1959/ASR
CONDO/A
24452
Ward ST  $700,000  $    510.95
3/1,1,0,0 1370/A 1981/ASR
SFR/D
3322
Dalemead ST  $750,055  $    702.96
3/1,0,0,0 1067/A 1950/ASR
SFR/D
3213
Dalemead ST  $840,000  $    787.25
3/1,1,0,0 1067/T 1950/ASR
DPLX/D
24240
Ocean AVE  $900,000  $    348.70
9/4,1,0,0 2581/A 1955/ASR
SFR/D
3200
Newton ST  $1,020,000
 $    447.37
4/2,0,1,0 2280/B 1993/ASR
SFR/D
2849
Windmill RD  $1,059,000
 $    511.10
4/2,0,0,0 2072/A 1975/ASR
SFR/D
25932
Richville DR  $1,305,000
 $    446.00
4/2,0,1,0 2926/A 1956/ASR
COOP/A
3110
Merrill DR #85  $477,900  $    367.62
2/1,1,0,0 1300/E 1964/ASR
COOP/A
3210
Merrill DR #32  $480,000  $    342.86
3/1,1,0,0 1400/A 1963/ASR
CONDO/A
2567
Plaza Del Amo#308  $500,000  $    574.71
1/1,0,1,0 870/A 1985/ASR
CONDO
3520
Maricopa ST #5  $520,000  $    389.22
2/2,0,1,0 1336/A 1975
TWNHS/A
2800
Plaza Del Amo #266  $655,000  $    514.53
2/3,0,0,0 1273/A 1988/ASR
TWNHS/A
3508
Del Amo Bl  $700,000  $    422.45
4/3,0,0,0 1657/A 1974/BLD
TWNHS/A
2300
Maple AVE #231  $780,000  $    417.78
4/3,0,0,0 1867/A 1987/ASR
TWNHS/A
4312
Spencer ST  $880,000  $    359.77
3/2,2,1,0 2446/A 1989/PUB
SFR/D
902
Cerise AVE  $892,000  $    527.19
3/2,0,0,0 1692/A 1951/ASR
SFR/D
2623
Bayport DR  $940,000  $    370.96
4/2,0,1,0 2534/A 1987/ASR
SFR/D
3708
Michelle DR  $950,000  $   436.98
4/3,0,0,0 2174/A 1969/ASR
CONDO/A
24410
Crenshaw Bl #211  $265,000  $    356.66
1/1,0,0,0 743/A 1987/ASR
CONDO/A
22911
Nadine CIR #A  $480,500  $    430.17
2/2,0,0,0 1117/A 1963/ASR
CONDO/A
23053
Nadine CIR #A  $510,500  $    457.03
2/2,0,0,0 1117/A 1963/ASR
CONDO/A
22927
Maple AVE  $544,250  $    562.82
2/2,0,0,0 967/A 1963/ASR
TWNHS/A
2992 W
235th ST  $730,000  $    450.34
3/3,0,0,0 1621/A 2000/ASR
SFR/D
3735 W
226th ST  $790,000  $    714.29
3/1,1,0,0 1106/A 1953/ASR
SFR/D
22715
Eriel AVE  $952,702  $    496.46
4/2,0,0,0 1919/A 1960/ASR
SFR/D
4521
Greenmeadows AVE  $ 1,090,000
 $    699.61
3/1,0,1,0 1558/A 1953/ASR
SFR/D
4625
Paseo De Las Tortugas  $ 1,295,000
 $    810.39
3/1,1,0,0 1598/A 1956/ASR
CONDO/A
3970
Sepulveda Blvd #206  $620,000  $    413.33
2/2,0,0,0 1500/B 2007/ASR
SFR/D
22939
Ocean AVE  $820,000  $    554.43
3/2,0,0,0 1479/A 1955/ASR
CONDO/A
22485
Kent AVE  $839,000  $    406.89
3/3,0,0,0 2062/A 1999/ASR
SFR/D
22621
Susana AVE  $850,000  $1,049.38 3/1,0,0,0 810/A 1952/ASR
SFR/D
3921 W
234th PL  $866,000  $    513.34
4/2,0,0,0 1687/A 1962/ASR
SFR/D
4713
Vanderhill RD  $890,000  $    772.57
3/2,0,0,0 1152/A 1956/ASR
SFR/D
23148
Anza AVE  $900,000  $    585.94
3/2,0,0,0 1536/A 1960/ASR
SFR/D
23430
Evalyn AVE  $1,035,000
 $   449.02
5/1,2,0,0 2305/A 1962/PUB
SFR/D
5006
Sharynne LN  $1,750,000
 $    673.08
4/2,1,0,0 2600/E 1949/ASR
CONDO/A
5500
Torrance BLVD #C323  $615,000  $    453.54
3/2,0,0,0 1356/A 1990/ASR
CONDO/A
21345
Hawthorne BLVD #101  $665,000  $    540.65
3/2,0,0,0 1230/A 2005/ASR
SFR/D
5125
Sepulveda BLVD  $785,000  $    675.56
3/1,1,0,0 1162/A 1955/OTH
SFR/A
4018
TORRANCE  $875,000  $    506.95
3/2,0,0,0 1726/ 1956
SFR/D
21713
Ladeene AVE  $921,000  $    792.60
3/1,1,0,0 1162/A 1956/ASR
SFR/D
5215
Scott ST  $960,000  $    541.46
3/1,1,0,0 1773/A 1955/PUB
SFR/D
5109
Beran ST  $961,000  $    438.61
4/4,0,0,0 2191/A 1955/PUB
SFR/D
21502
Linda DR  $1,000,000
 $    547.05
4/2,0,1,0 1828/A 1955/ASR
TWNHS/A
3727
Emerald ST #B  $600,000  $    531.91
2/2,0,1,0 1128/A 1987/ASR
SFR/D
5105
Arvada ST  $730,000  $    421.48
3/2,0,0,0 1732/A 1954/ASR
COMRES/A
3642
Garnet ST  $800,000  $    148.45
11/7,0,0,0 5389/A 1973/PUB
TWNHS/A
4489
Spencer ST #302  $830,000  $    405.27
3/2,0,1,0 2048/A 1995/ASR
SFR/D
4765 W
191st ST  $855,000  $    439.14
4/2,0,0,0 1947/A 1954/ASR
TWNHS/D
20508
EARL ST  $875,000  $    446.20
3/2,0,2,0 1961/ 2004
SFR/D
19905
Mansel AVE  $909,500  $    649.18
3/1,1,0,0 1401/A 1955/ASR
SFR/D
20015
Saltee AVE  $940,000  $    654.14
3/2,0,0,0 1437/A 1955/ASR
SFR/D
20019
Mildred AVE  $1,300,000
 $    591.72
4/1,1,1,0 2197/A 1970/ASR
SFR/D
5515
Arvada ST  $1,360,000
 $    486.06
4/4,0,0,0 2798/A 1956/ASR
TWNHS/A
3429 W
171st ST  $499,000  $    352.40
3/1,0,1,0 1416/A 1974/ASR
SFR/A
18334
FALDA AVE  $573,500  $    656.93
2/1,0,0,0 873/ 1953/BLD
SFR/D
3633 W
177th ST  $580,000  $    657.60
2/1,0,0,0 882/A 1953/ASR
SFR/D
18327
Elgar AVE  $610,000  $    690.05
3/1,0,0,0 884/A 1953/ASR
SFR/D
17008
Ermanita AVE  $695,000  $    630.10
3/1,1,0,0 1103/A 1951/ASR
SFR/D
17108
Glenburn AVE  $700,000  $    596.25
2/2,0,0,0 1174/A 1948/ASR
SFR/D
18820
Patronella AVE  $705,000  $    595.94
3/1,0,1,0 1183/A 1953/PUB
SFR/D
16623
Falda AVE  $711,750  $    564.88
3/2,0,0,0 1260/A 1952/ASR
SFR/D
3621 W
177th Street  $720,000  $    435.31
3/2,0,0,0 1654/A 1953/ASR
SFR/D
3709 W
180th PL  $750,000  $    496.03
4/2,0,0,0 1512/A 1953/ASR
SFR/D
16705
Francis CT  $769,000  $    372.76
4/3,0,0,0 2063/A 1963/ASR
SFR/D
3633 W
181st ST  $795,000  $    485.35
3/2,0,0,0 1638/A 1953/ASR
TWNHS/D
18512
Roslin AVE  $799,000  $    392.44
3/4,0,0,0 2036/B 2018/BLD
SFR/D
16815
Fonthill AVE  $815,000  $    372.32
4/2,0,0,0 2189/ 1954
SFR/D
3733
Sandgate DR  $815,000  $    449.53
4/3,0,0,0 1813/D 1960/ASR
SFR/D
18932
Florwood AVE  $833,000  $    374.89
5/2,0,1,0 2222/A 1953/ASR
SFR/D
18328
Roslin AVE  $894,000  $    517.96
4/3,0,0,0 1726/B 1949/ASR
SFR/D
4345 W
190th ST  $985,000  $    321.90
4/4,0,0,0 3060/A 2006/ASR
TWNHS/A
2052
Artesia  $520,000  $    448.28
2/2,0,1,0 1160/A 2001/ASR
SFR/A
2603 W
166th PL  $605,000  $    395.68
4/1,1,0,0 1529/A 1955/ASR
SFR/D
2502 W
170th ST  $625,000  $    520.83
3/2,0,0,0 1200/A 1955/ASR
SFR/D
2618 W
180th ST  $645,000  $    338.23
4/3,0,0,0 1907/A 1956/ASR
SFR/D
18902
Haas AVE  $680,000  $    406.94
3/2,0,0,0 1671/A 1951/ASR
SFR/D
16403
Wilkie AVE  $689,000  $    662.50
3/1,1,0,0 1040/A 1951/ASR
SFR/D
2418 W
180th PL  $710,000  $    584.36
3/1,1,0,0 1215/A 1956/ASR
TWNHS/A
17510
Van Ness Avenue #5  $795,000  $    461.14
3/2,0,2,0 1724/B 2018/BLD
TWNHS/A
17508
Van Ness Avenue #4  $800,000  $    464.04
3/2,0,2,0 1724/B 2018/BLD
2454
Del Amo BL      $    805.00
1/1,0 650/A 1948
TWNHS/A
2160
Plaza Del Amo #178  $560,000  $    368.42
3/2,0,1,0 1520/A 1979/PUB
TWNHS/A
2714
Cabrillo AVE  $677,500  $    410.61
2/2,0,0,1 1650/A 2006/ASR
TWNHS/A
813
Van Ness AVE #B  $689,000  $    490.04
3/3,0,0,0 1406/A 2000/ASR
TWNHS/A
2444
Cabrillo AVE  $695,000  $    566.42
2/2,0,1,0 1227/D 2018/BLD
SFR/D
1308
Cota AVE  $700,000  $    628.93
2/1,1,0,0 1113/A 1926/ASR
TWNHS/A
1800
Oak St. #519  $705,000  $    473.15
2/2,0,1,0 1490/A 2007/ASR
TWNHS/A
1800
Oak ST #103  $760,000  $    383.84
2/2,0,1,0 1980/A 2007/ASR
SFR/D
23305
Huber AVE  $740,000  $    439.43
3/2,0,0,0 1684/A 1948/PUB
SFR/D
1846
Reynosa DR  $765,000  $    467.03
4/2,0,0,0 1638/A 1948/ASR
SFR/D
2218 W
229th PL  $795,000  $    388.18
3/3,0,0,0 2048/A 1962/ASR
SFR/D
2155 W
235th PL  $927,900  $    388.89
4/3,0,0,0 2386/A 1974/ASR

As Interest Rates Rise….how Does it Impact Torrance Home Buyers?

Many prospective home buyers are concerned with rising interest rates.  While the Torrance interest rates in 2018 are still historically very low, the concern is justified.  Higher interest rates mean reduced buying power.  With every slight rise in interest rates, the monthly payment increases reducing the price of a home that a buyer can qualify for.  See the chart below for an idea of how different interest rates impact monthly payment and what a buyer’s income needs to be to qualify.

Coins in tabular chart

Historical Interest Rates since 1972

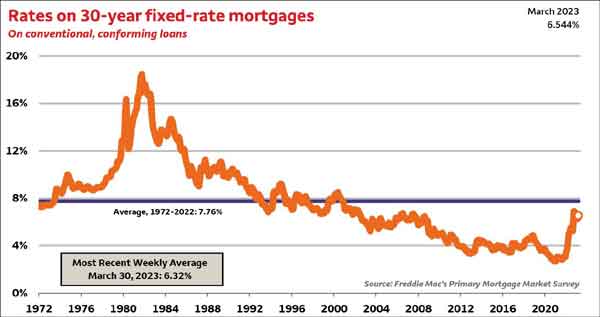
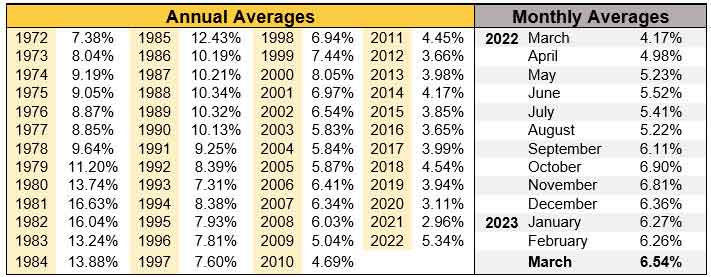
Many Torrance CA buyers are concerned with interest rates rising with the Fed making it clear that rates will slowly increats.  That’s certainly a valid concern for potential Torrance homebuyers as a higher interest rate means a higher monthly payment which most often means a lower priced home.  Taken in historical standpoint the current rates are dramatically lower than at just about any other time.  The chart below shows the interest rate on conventional and conforming 30 year fixed rate mortgages.  As we’ll see we’ve basically seen rates drop consistently since the high water mark of 16.3% in 1981.  It certainly makes todays current rate in the mid 4% range seem pretty enticing.


CONTACT US

for all of your Torrance real estate services

your torrance realtor

Torrance realtor Keith Kyle
Keith Kyle
Realtor

DRE#01712785

Vista Sotheby's logo

REALESTATETORRANCE – All rights reserved – Designed and Developed by Keith Kyle Homes