Torrance homes for sale

Real Estate Market Trends in South Torrance

When buying or selling homes in South Torrance, knowing and understanding the real estate market is critical to making the right decision. Real estate trends can help determine current values or even when the appropriate time to list and sell your South Torrance home. The information below is intended to help you get a better understanding of what is happening in the market.

The chart below shows the number of active listings (light green) sold homes (dark green) and pending home sales (red line) The greater the discrepancy between active homes and sold homes indicates a buyers market and when the numbers are closer a sellers market is indicated as inventory is down.

The chart below shows the average price per square foot. Square footage in the South Bay often doesn’t mean as much as in other markets as values can vary so dramatically due to things such as proximity to the beach, views, specific neighborhoods.

The chart below shows the average days on market per month as well as the % of list price that homes sold at. A high % indicates a sellers market as home sell at, or above list price.

The chart below shows the average price for listed home sales in relation to the average price for sold homes.

The chart below indicates the months of home inventory based on closed home sales. Buyer’s market: more than 6 months of inventory Seller’s market: less than 3 months of inventory Neutral market: 3 – 6 months of inventory

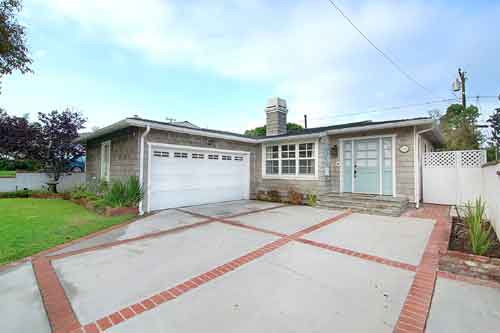
Hollywood Riviera homes for sale - 340 Via Colusa

West Torrance Real Estate Market Trends

When buying or selling homes in West Torrance, knowing and understanding the real estate market is critical to making the right decision. Real estate trends can help determine current values or even when the appropriate time to list and sell your West Torrance home. The information below is intended to help you get a better understanding of what is happening in the market.

The chart below shows the number of active listings (light green) sold homes (dark green) and pending home sales (red line) The greater the discrepancy between active homes and sold homes indicates a buyers market and when the numbers are closer a sellers market is indicated as inventory is down.

The chart below shows the average price per square foot. Square footage in the South Bay often doesn’t mean as much as in other markets as values can vary so dramatically due to things such as proximity to the beach, views, specific neighborhoods.

The chart below shows the average days on market per month as well as the % of list price that homes sold at. A high % indicates a sellers market as home sell at, or above list price.

The chart below shows the average price for listed home sales in relation to the average price for sold homes.

The chart below indicates the months of home inventory based on closed home sales. Buyer’s market: more than 6 months of inventory Seller’s market: less than 3 months of inventory Neutral market: 3 – 6 months of inventory
Hollywood Riviera Real Estate Market Trends

When buying or selling homes in the Hollywood Riviera neighborhood of Torrance and Redondo Beach, knowing and understanding the real estate market is critical to making the right decision. Real estate trends can help determine current values or even when the appropriate time to list and sell your Hollywood Riviera home. The information below is intended to help you get a better understanding of what is happening in the market.

The chart below shows the number of active listings (light green) sold homes (dark green) and pending home sales (red line) The greater the discrepancy between active homes and sold homes indicates a buyers market and when the numbers are closer a sellers market is indicated as inventory is down.


The chart below shows the average price per square foot. Square footage in the South Bay often doesn’t mean as much as in other markets as values can vary so dramatically due to things such as proximity to the beach, views, specific neighborhoods.

The chart below shows the average days on market per month as well as the % of list price that homes sold at. A high % indicates a sellers market as home sell at, or above list price.

The chart below shows the average price for listed home sales in relation to the average price for sold homes.

The chart below indicates the months of home inventory based on closed home sales. Buyer’s market: more than 6 months of inventory Seller’s market: less than 3 months of inventory Neutral market: 3 – 6 months of inventory

Will Overpricing Help Slow the Market Down?

By Keith KyleTorrance Homes

I’ve noticed an early January trend in some of the local markets as many homes now seem to be listed at prices that recent sales just don’t seem to justify. Will this overpricing help slow the market down a little as we’re starting to see some homes sit on the market and even eventual price reductions.

We’ve seen the market increase in value dramatically in the past 12 months with values generally rising each month but since late November we seem to be seeing more homes priced well above the current market and well above the pricing trend. Only time will tell what 2014 has in store in the Beach Cities real estate market but as perception is such a real part of real estate, buyers now seeing homes sit on the market without selling may mark the beginning of a slow down.

CONTACT US

for all of your Torrance real estate services

your torrance realtor

Torrance realtor Keith Kyle
Keith Kyle
Realtor

DRE#01712785

Vista Sotheby's logo

REALESTATETORRANCE – All rights reserved – Designed and Developed by Keith Kyle Homes