What makes the Torrance real estate market so unique?
By Keith Kyle
People often think of the South Bay as one large market but each individual city can mean an entirely different real estate market….just take a look at the monthly median home prices in the South Bay as an indication.
Each city is it’s own real estate market but Torrance is different. As Torrance is the largest city in the South Bay it’s also the most diverse. That’s especially true in terms of real estate and home values in Torrance.
What make Torrance so different is the variety of areas, and the diversity of both the homes and the prices. Torrance is a city that has multi million dollar homes along the Bluff on Paseo De La Playa and also has some of the most affordable homes in all of the South Bay.
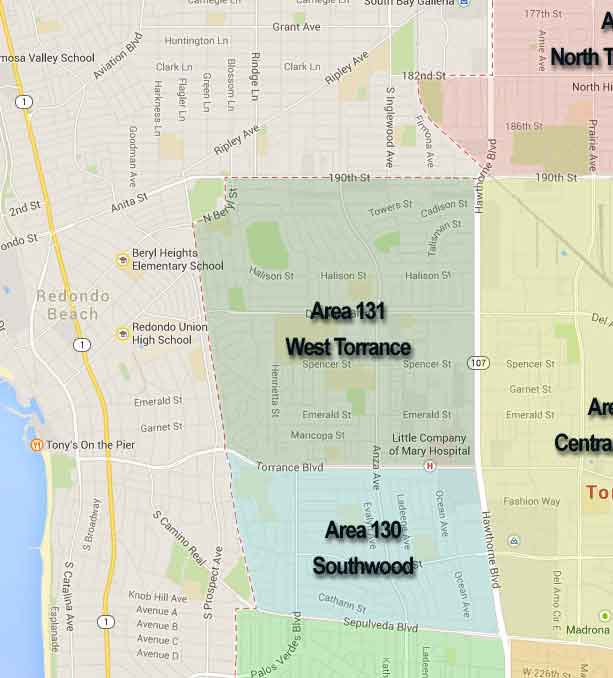
Search Torrance homes by area.
The sheer size of Torrance also makes a difference. Stretching all the way from the ocean to east of the 110 freeway makes for an abundance of options not possible in any other city in the area. This also allows for everything from single family homes, to condos to even co-ops (rarely seen in the South Bay).
It is definitely not a seen one seen em all type real estate market.