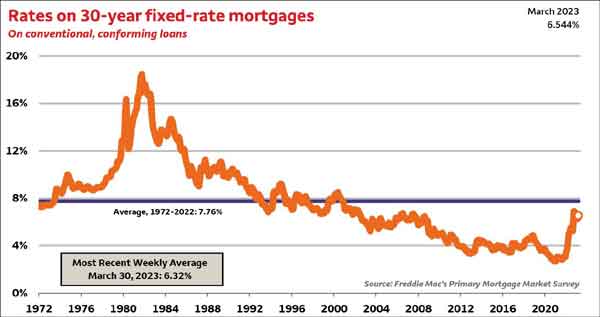
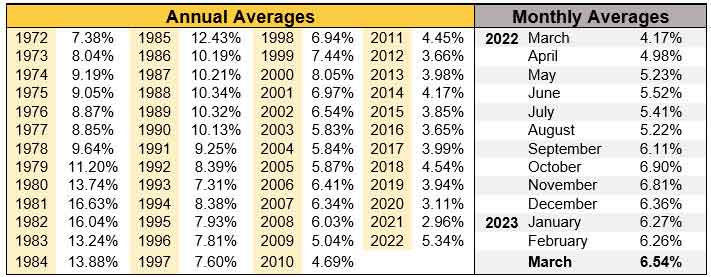
November 2017 was a solid month for home sales in Torrance, CA.
There were 117 homes, townhomes, condos and multi unit properties sold in the month at a median home price of $700,000 which was a 6.6% increase from the same month a year earlier. The number of sales was down slighty from October which saw 127 homes sell.
The lowest price of the month was $265,000 for a one bedroom condo with the highest priced sale of the month being $1,550,000 for a 4 bedroom single family home in South Torrance.
To see the sold homes in Torrance CA visit our recent home sales page.
| City |
# of sold homes |
November 2017 Median |
November 2016 Median |
Year over Year % Change% |
| Carson |
49 |
$476,000 |
$450,000 |
5.9% |
| El Segundo |
12 |
$1,243,000 |
$816,000 |
52.3% |
| Gardena |
52 |
$533,000 |
$504,000 |
5.7% |
| Harbor City |
10 |
$555,000 |
$523,000 |
6.1% |
| Hawthorne |
30 |
$577,000 |
$575,000 |
.3% |
| Hermosa Beach |
20 |
$1,550,000 |
$1,380,000 |
12.3% |
| Lawndale |
18 |
$515,000 |
$393,000 |
31.2% |
| Lomita |
11 |
$599,000 |
$473,000 |
26.8% |
| Long Beach |
318 |
$510,000 |
$490,000 |
4% |
| Manhattan Beach |
35 |
$2,300,000 |
$1,863,000 |
23.5% |
| Marina Del Rey |
33 |
$925,000 |
$955,000 |
-3.1% |
| Palos Verdes Estates |
27 |
$1,510,000 |
$1,550,000 |
-2.6% |
| Playa Del Rey |
21 |
$710,000 |
$658,000 |
7.9% |
| Rancho Palos Verdes |
31 |
$1,108,000 |
$1,088,000 |
1.8% |
| Redondo Beach |
79 |
$955,000 |
$900,000 |
6.1% |
| San Pedro |
55 |
$550,000 |
$515,000 |
6.8% |
| Torrance |
117 |
$700,000 |
$656,000 |
6.6% |
| Westchester |
35 |
$1,015,000 |
$943,000 |
7.6% |