Great Short Sale Opportunity in South Torrance – In Escrow

Short sale opportunities have just about dried up in the South Bay with homeowners quickly regaining any lost value after the bubble burst.  Although no longer  commonplace and not the deals they once were, short sales and foreclosures still do occasionally come along.

Just listed is a very nice sized home in a great South Torrance neighborhood at 4026 W 234th Street 90505.  The home features 3 bedrooms, 2 baths, and an impressive 2171 square feet.

[idx-listing mlsnumber=”7529016010″ showall=”true”]

South Torrance homes

Spectacular Estate for Sale at 23135 Doris Way in South Torrance

Looking more like an estate found in Palos Verdes than a home in SouthSouth Torrance homes Torrance, the recent listing at 23135 Doris Way is spectacular in just about every way.  Sitting on a 15,000+ lot, which is extremely rare, even in South Torrance, the home offers the best of all worlds.  Spacious and luxurious interiors with 4600 square feet, 5 bedrooms, and 7 baths.  Built in 2005 this beautiful home offers a level of luxury usually only seen in nearby Palos Verdes and Manhattan Beach.  Contact us for more information.

Chatelaine in Plaza Del Amo

The Gated Townhome Communities of Plaza Del Amo Torrance

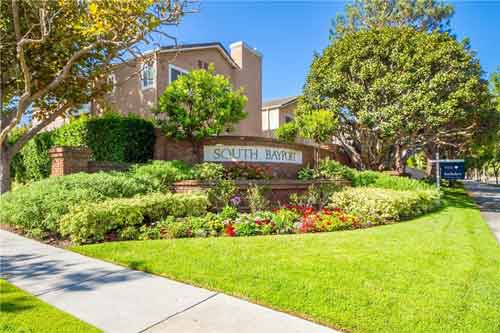
By Keith KyleSouth Bayport in Plaza Del Amo Torrance

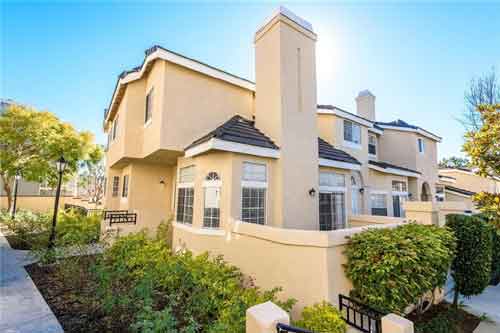
Central Torrance offers a series of communities fairly unique in the South Bay known as the Plaza Del Amo area offering an abundance of townhome style homes in several gated communities.  Although each community has a different name and HOA, they are generally located on Plaza Del Amo in the 90501 zip code.  Ideally located near major shopping centers, recreational facilities, parks, and restaurants, the communities of Plaza Del Amo are fantastic housing options for buyers looking for good areas, good schools, gated communities with an abundance of activities.

Click here to view the current homes in Plaza Del Amo

Prices currently range from the high $300,000s for one of the few one bedroom condo style units to around $800,000 for a much larger 4 bedroom detached townhome (often marketed as single family homes).  Most complexes offer pools and various other community buildings.

Want and even easier way to search for homes?  Tell us just a bit about what you’re looking for in a home and we’ll customize a search just for you and send you email alerts whenever a new home hits the market.  Never miss a new listing in Torrance and Plaza Del Amo again!

One of the aspects that make the areas and communities desirable is the highly rated Torrance school system and the area is generally served by Hickory Elementary, Madrona Middle School and Torrance High.

For information on specific complexes and other helpful real estate and community details visit our Plaza Del Amo real estate blog site.

Most of the complexes are located east of Madrona, west of Crenshaw and just north of Sepulveda.  Some of the many complexes are:

Gated communities and complexes near Plaza Del Amo

Current Plaza Del Amo Torrance Homes for Sale


Real Estate Map of Plaza Del Amo

plaza del amo

Pocket and Off Market Listings are All the Rage in Torrance CA

By Keith KyleWest Torrance Homes

If you’re a home buyer at the moment, you’ve probably been a little frustrated with just how little housing inventory there is, how quickly the good homes sell, and how often they sell for far more than they were listed.  You’ve probably also heard the terms pocket listings and off market listings as those are definitely the buzz words of the moment.

So what do these words really mean and how do you find out about them?

Pocket listings and off market listings can mean several things, but basically they are homes that agents may, or may not, have formal agreements to sell, but are aware the sellers are interested in selling.  Most often the realtor has a written agreement to represent the sellers, but for one reason or another, the sellers either don’t want their home to be put on the MLS or perhaps they just aren’t quite ready.  In other situations it may be far more informal with either the homeowner telling a realtor “bring me a buyer and maybe I’ll sell” or something in which the owner would only consider selling at a price over the market value of the home.

So how does this help you?

The concept is pretty simple….the fewer buyers that know about a home the better the chances of having your offer considered and accepted.  Without the buyer frenzy that comes with most new listings these days the price may be kept at a reasonable level as well.

Torrance Home UpdatesSo how do you find these homes?

The best way to find these off market listings is to work with a successful local agent that specializes in the area you’re interested in.  It’s all about networking and the more owners, sellers and other agents the realtor is in contact with the more likely they may have ways of finding listings the public isn’t aware of.   Good agents will also actively seek out some unknown sellers with letters or even by door knocking.  Buyers can certainly try this on their own as well, but just won’t have the same reach as a well connected local agent.  If you would like us to help simply fill out our “let me know about pocket listings form” and specify if you want us to update you on all listings….or just the homes not on the market.

Be realistic

Although many deals are happening off market and it is a very good way of trying to find a home in a very challenging sellers market, buyers must be realistic.  Finding something off market generally doesn’t mean paying 70% of it’s value.  In our very high end market in which sellers have resources and information to know what their homes are worth, sellers are very savvy and often only willing to sell their homes off market if the price is right.

4171 w 172nd St Torrance

North Torrance West Real Estate Statistics

By Keith Kyle

As knowledge is critical in real estate, we hope that the information provided below will make the real estate market in the North West areas of Torrance easier to understand and the trends can make for educated decisions. Whether you are a buyer, or a seller, knowing what the market is doing and where it appears to be heading can make all of the difference in the world. If we can be of assistance in any way please don’t hesitate to contact us. You can view these trends for all Torrance CA neighborhoods.

View the current North Torrance – West Homes for Sale

The chart below shows the recent history of the number of active listings, pending home sales and closed escrows. The higher ratio of active to sold/pending listings shows a buyers market while lower inventory shows a sellers market.

The chart below shows the average price per square foot in North Torrance West. This includes all types of homes including condos, townhomes and single family homes

The chart below shows the percentage of sold price / list price at which an equal number of properties are sold above, equal or below the list price and it indicates how long it has taken to sell those properties.

The chart below shows the difference between the average price for sale in North Torrance and average price of the sold homes. It helps determine whether the market is a buyer or seller market. If the average listing price and average sold price are the closest, the area has the healthiest market.

The chart below shows the months of inventory for a particular month. As a rule of thumb, an inventory level of less than three indicates a strong seller market while an inventory level greater than six indicates a buyer’s market.


CURRENT NORTH TORRANCE WEST HOMES FOR SALE
[idx-listings community=”132 – N Torrance – West” statuses=”1″ orderby=”DateAdded” orderdir=”DESC” count=”25″ showlargerphotos=”true” listtabalignment=”Left”]

County Strip and Harbor Gateway Torrance Real Estate Statistics

By Keith Kyle

As knowledge is critical in real estate, we hope that the information provided below will make the real estate market in the County Strip/Harbor Gateway areas of Torrance easier to understand and the trends can make for educated decisions. Whether you are a buyer, or a seller, knowing what the market is doing and where it appears to be heading can make all of the difference in the world. If we can be of assistance in any way please don’t hesitate to contact us. You can view these trends for all Torrance CA neighborhoods.

The chart below shows the recent history of the number of active listings, pending home sales and closed escrows. The higher ratio of active to sold/pending listings shows a buyers market while lower inventory shows a sellers market.

The chart below shows the average price per square foot in the County Strip and Harbor Gateway areas of Torrance. This includes all types of homes including condos, townhomes and single family homes

The chart below shows the percentage of sold price / list price at which an equal number of properties are sold above, equal or below the list price and it indicates how long it has taken to sell those properties.

The chart below shows the difference between the average price for sale in the 90502 zip codes and average price of the sold homes. It helps determine whether the market is a buyer or seller market. If the average listing price and average sold price are the closest, the area has the healthiest market.

The chart below shows the months of inventory for a particular month. As a rule of thumb, an inventory level of less than three indicates a strong seller market while an inventory level greater than six indicates a buyer’s market.

[idx-listings zip=”90502″ statuses=”1″ propertytypes=”514″ orderby=”DateAdded” orderdir=”DESC” count=”5″ showlargerphotos=”true”]

CONTACT US

for all of your Torrance real estate services

your torrance realtor

Torrance realtor Keith Kyle
Keith Kyle
Realtor

DRE#01712785

Vista Sotheby's logo

REALESTATETORRANCE – All rights reserved – Designed and Developed by Keith Kyle Homes