Torrance CA Home Prices Continue to Rise in December

By Keith KyleSold Sign Torrance

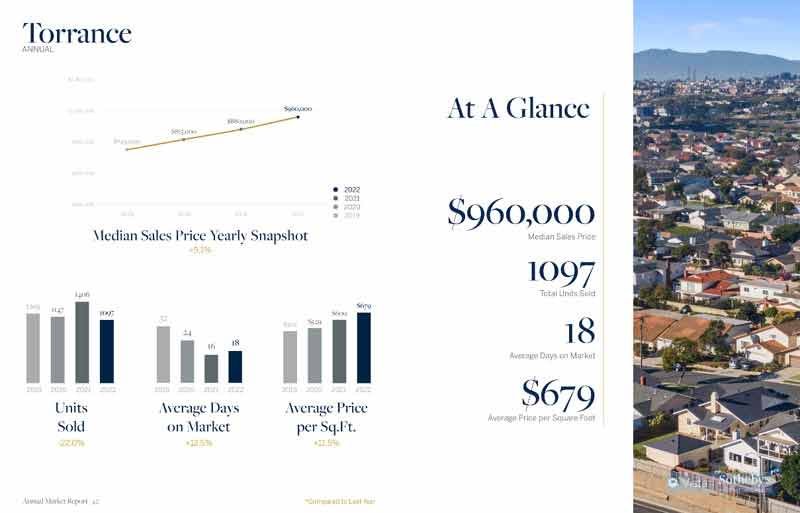
The December numbers are in and if there was any thought that the real estate market in Torrance was slowing down or leveling the numbers certainly say otherwise.

The average home price in Torrance for the homes that closed escrow during December was $620,851* with a median price of $619,000*.  Those are big numbers that still shows no sign of slowing or reversing.   See the chart below for the December home sales numbers for Torrance and the South Bay for December of 2015.

*Based on MLS sales only.  Does not include off market sales information

City Homes
Sold
December
2015 Median
December
2014 Median
Year
over Year % Change
Carson  73 $360,000 $365,000 -1.4%
El Segundo 10 $949,000 $735,000 20.2
Gardena 41 $420,000 $385,000 9.1%
Harbor City 15 $483,000 $467,000 9.1%
Hawthorne 35 $508,500 $667,750 -23.8%
Hermosa Beach 24 $1,475,000 $1,360,000 8.5%
Lawndale 13 $420,000 $415,000 1.2%
Lomita 16 $520,000 $490,000 6.1%
Long Beach 339 $456,000 $395,000 15.4%
Manhattan Beach 34 $2,184,000 $1,689,000 29.3%
Marina Del Rey 31 $905,000 $759,000 19.2%
Palos Verdes Estates 29 $1,456,000 $1,150,000 26.7%
Playa Del Rey 17 $605,000 $482,000 25.5%
Rancho Palos Verdes 48 $1,170,000 $1,135,000 3.1%
Redondo Beach 89 $836,250 $770,000 7.3%
San Pedro 72 $517,500 $492,000 5.2%
Torrance 122 $619,000 $562,000 10.1%
Westchester 34 $951,000 $807,500 17.8%
Hollywood Riviera homes for sale - 340 Via Colusa

So Where’s The Big Seasonal Increase in Homes in Torrance?

By Keith KyleHollywood Riviera homes for sale - 340 Via Colusa

As a realtor who has been doing this a while, I’ve come to expect a nice increase in houses for sale in mid to late January. As the holidays wrap up, football season ends, and everyone gets back to work, we generally see a nice increase in homes that hit the market. It can often set the tone for much of the year as and abundance of homes early in the year often seems to stabilize the market one way or another. Unfortunately 2015 hasn’t seen that increase as the number of active homes for sale continues to go down at a time when the homes for sale should be going up. It’s still early enough that sellers may yet be holding off for a week or two to put their homes on the market and it would be welcome relief for the home buyers sitting and waiting.

The chart below shows the number of homes for sale represented by the light green bar. As of January 29th there are only 161 homes for sale in all of Torrance.


Townhomes for sale - 2209 Nelson

Torrance Home Inventory Continues to Decline in Early 2015

By Keith Kyle

Townhomes for sale - 2209 Nelson
2209 Nelson

The housing inventory in Torrance, CA is continuing to shrink with the number of available homes for sale decreasing every month since July of 2014.    The first half of 2014 saw a month over month increase in the available homes peaking in the busy summer buying season but that momentum didn’t last.  The peak month of July saw 232 homes available which has gone down every month since.  As of this post there are currently 151 homes currently on the market in the South Bay’s largest city.  The chart below shows the monthly numbers for active homes for sale (light green) current escrows (red line) and closed home sales (dark green).  Please don’t hesitate to contact us with any questions about the market or to receive an updated list of the current homes for sale.


Current Torrance CA Foreclosures and Short Sales

Updated January 20th, 2015Torrance Home Values

While the number of distressed home sales in Torrance has dropped considerably in the past 2 years there are still a number of homes for sale at some stage of the foreclosure process.  Although these homes are not quite the bargains they were there are some homes that are still priced below market value due to the extra work and patience required by the home buyers.  The process has certainly gotten streamlined by the banks but they are still not as straightforward as traditional sales.

Current Torrance short sales

MLS# Type   Address Type  Price  Bed/Bath Year Built Sq Feet
PW14096768 CONDO/A 22334 Harbor Ridge LN #2 FOR, NOD, SPAY  $340,000 3/2,0,1,0 1980/ASR 1553/A
CV14230210 SFR/D 1157 W 225th ST #A FOR, NOD, SPAY  $639,000 5/3,0,0,0 2007/ASR 3068/A
PV14142427 TWNHS/A 3090 Newton ST NOD, SPAY  $629,000 2/3,0,0,0 2003/ASR 1852/A
OC14157232 SFR/D 2693 Hillside DR FOR, NOD, SPAY  $899,900 4/3,0,0,0 1983/ASR 2698/A
14811725 SFR/D 3227 W 188TH ST SPAY  $549,000 4/3,0,0,0 1950 1854
14797349 SFR/D 2701 W 182ND ST SPAY  $450,000 2/1,0,0,0 1946 961
PW14211431 SFR/D 2756 Border AV SPAY  $565,000 3/2,0,1,0 2003/ASR 2020/A

Current Bank Owned Homes and Foreclosures

MLS# Type   Address Type  Price  Bed/Bath Year Built Sq Feet
SB14231286 SFR/D 1323 W 227th ST REO  $369,900 4/2,0,0,0 1956/ASR 1377/A
DW15005743 SFR/D 2119 W 187th ST REO  $508,300 3/2,0,0,0 1959/ASR 1420/A

Torrance Sees Gain in Home Prices for November 2014

It’s clear that the real estate market slowdown for the holidays didn’t start in November.  At least not for the number of home sales and home prices in Torrance CA.  Torrance posted another strong month with 99 sold homes at a median price of $575,000.  To see the homes that sold in November visit our South Bay monthly home sales site.

City Homes
Sold
November
2014 Median
November
2013 Median
Year
over Year % Change
Carson 44 $385,000 $337,500 14.07%
El Segundo 7 $853,000 $710,000 20.14%
Gardena 36 $394,000 $366,000 7.65%
Harbor City 16 $450,000 $343,750 30.91%
Hawthorne 35 $436,250 $465,000 -6.18%
Hermosa Beach 12 $1,050,000 $1,089,000 -3.58%
Lawndale 12 $432,500 $320,000 35.16%
Lomita 13 $490,000 $400,000 22.50%
Long Beach 262 $380,000 $365,000 4.11%
Manhattan Beach 40 $1,900,000 $1,987,000 -4.38%
Marina Del Rey 32 $822,100 $1,000,000 -17.79%
Palos Verdes Estates 21 $1,860,000 $1,300,000 43.08%
Playa Del Rey 18 $519,750 $525,000 -1.00%
Rancho Palos Verdes 34 $935,000 $1,010,000 -7.43%
Redondo Beach 66 $790,000 $720,000 9.72%
San Pedro 47 $462,000 $422,500 9.35%

Torrance

99

$575,000

$517,000

11.22%

Westchester 27 $805,000 $749,000 7.48%
Torrance real estate 2022

Torrance Real Estate Market Trends

The market in Torrance has continued to be very favorable to sellers with the demand so high and the inventory still considerably low.  The past 3 months have seen a slight increase in inventory which may be temporary or may be showing signs that the very beginning of a more balanced market is on it’s way.  Keep in mind that Torrance is a big city and prices, demand, values, and trends can vary considerably throughout the city.  The chart below shows the number of active Torrance homes for sale (light green bar) the number of homes that went into escrow (red line) and the number of homes sold in that month (teal bar).  When the trend shows a monthly increase in homes for sale the market is heading towards a more balanced situation.  At the moment it is very much a sellers market.

For buyers, and especially first time buyers, the chart below is a helpful tool to determine what price to offer.  This is for all of Torrance and different neighborhoods vary, and certainly individual homes can be a different situation depending on what price is was listed at.  For the month of September selling prices were within 3% of the list prices.

What does this mean?

For buyers this generally means that “going in low” is probably not the right strategy.  Consult with your realtor as they should have a handle on what the value of the home should be and whether the asking price was set too high, or too low in the hopes of generating multiple offers and a potential bidding war.

CONTACT US

for all of your Torrance real estate services

your torrance realtor

Torrance realtor Keith Kyle
Keith Kyle
Realtor

DRE#01712785

Vista Sotheby's logo

REALESTATETORRANCE – All rights reserved – Designed and Developed by Keith Kyle Homes