Torrance neighborhood real estate map.

Torrance CA Real Estate Map – Search for Homes

Welcome to our Torrance CA Real Estate Map and Home Search

Torrance, California is a big city and it’s neighborhoods and areas vary considerably in the types of homes, feel of the neighborhood, and home prices.

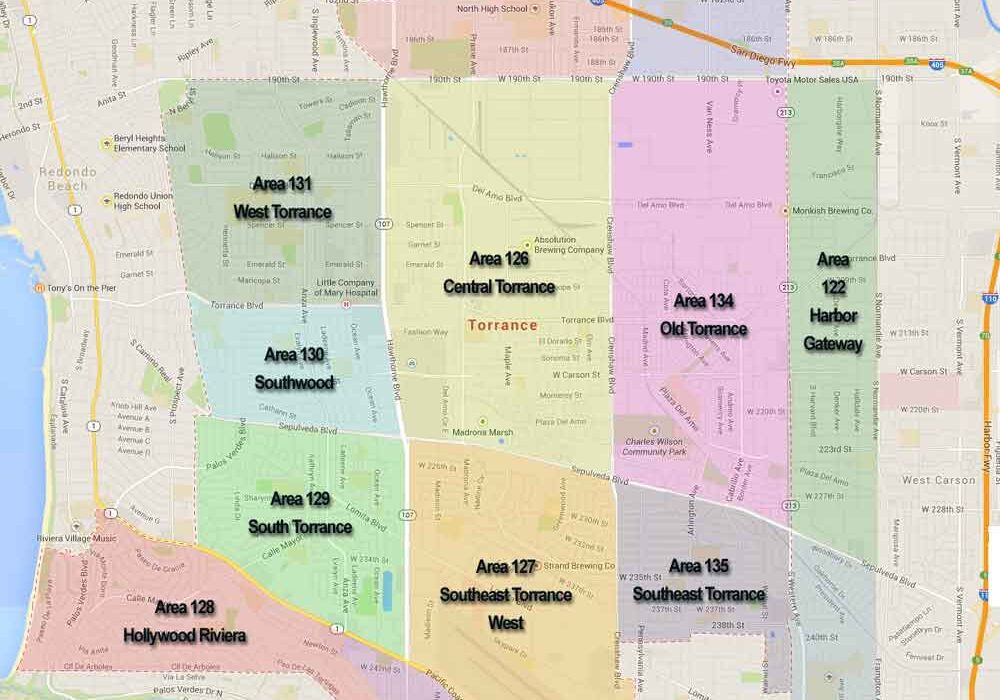
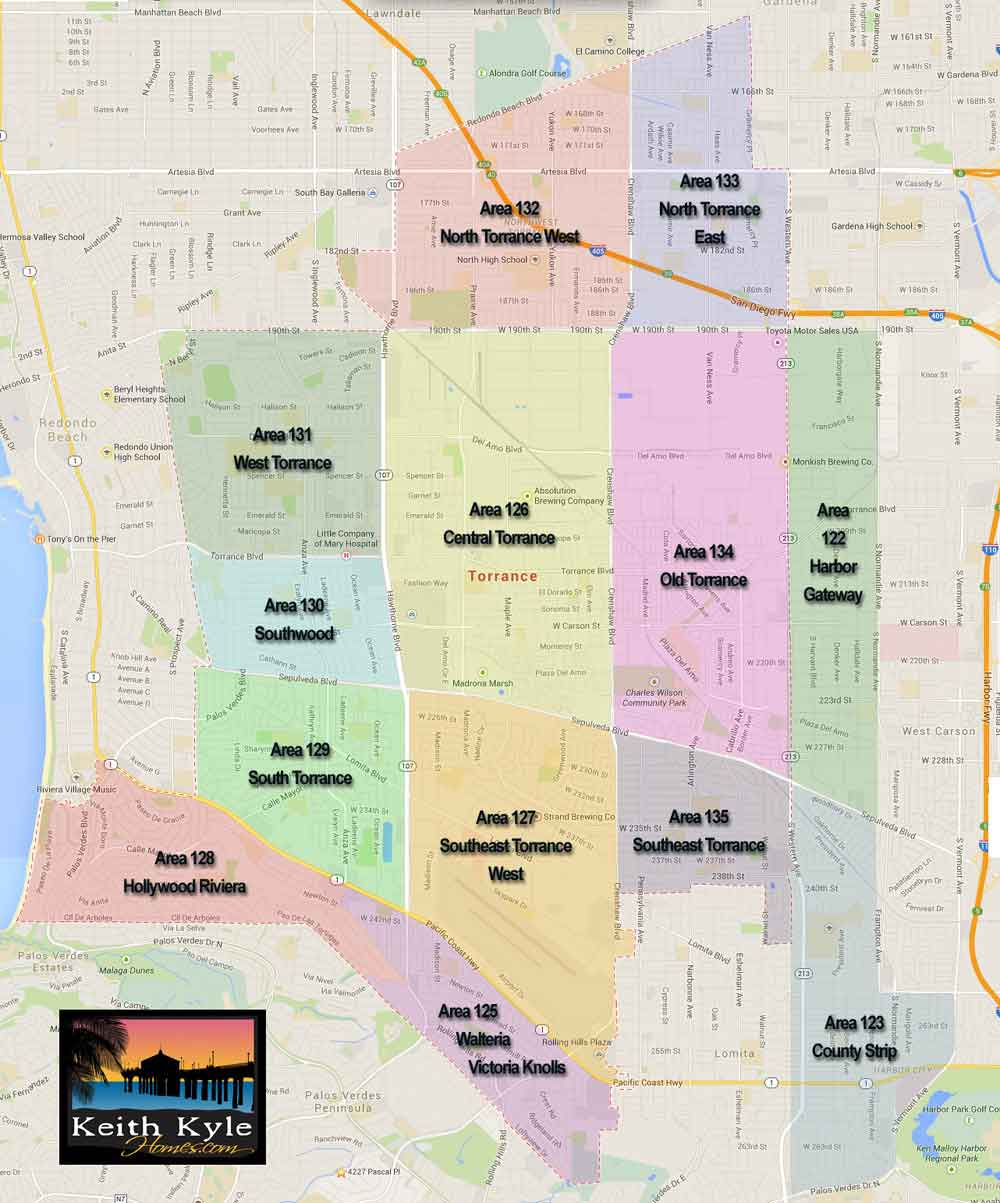
As realtors, we search for homes by neighborhood so that we can best assist our clients to find the right type of homes in the right areas.  Below is a map used by realtors and used in MLS home searches.  The numbers coincide with the areas that we use to search and each has it’s differences and similarities.  The three areas that often cause confusion are area 128 the Hollywood Riviera and areas 122 and 123, Harbor Gateway and County Strip.

Much of the Hollywood Riviera actually has Redondo Beach, 90277, zip codes but the area is actually part of Torrance and services and schools are Torrance.  The County Strip and Harbor Gateway areas actually have Torrance zip codes but are serviced by the city of Los Angeles.  It’s distance from the beach, proximity to commercial and industrial, and the schools being LA Unified makes the homes significantly less expensive then the city of Torrance areas.

The Neighborhoods of Torrance CA

North Torrance homes West Torrance homes Hollywood Riviera homes Walteria Torrance homes Southwood Torrance homes OldTorrance South Torrance homes Southeast Torrance homes Central Torrance Harbor Gateway Torrance

Search Homes in Torrance Neighborhoods

torrancehomesforsale
westtorrancehomes
southwoodtorrance
plaza del amo
old torrance homes
walteria torrance
north torrance homes
torrancerealestate
torrancehomes
redondo beach real estate
real estate trends

Old Torrance Real Estate Trends and Statistics

By Keith Kyle

As knowledge is critical in real estate, we hope that the information provided below will make the real estate market in Old Torrance easier to understand and the trends can make for educated decisions.  Whether you are a buyer, or a seller, knowing what the market is doing and where it appears to be heading can make all of the difference in the world.   If we can be of assistance in any way please don’t hesitate to contact us.  You can view these trends for all Torrance CA neighborhoods.

Number of active listings (light green) sold homes (dark green) and pending home sales (red line) 

The greater the discrepancy between active homes and sold homes indicates a buyers market and when the numbers are closer a sellers market is indicated as inventory is down.

Average price per square foot.

Square footage in the South Bay often doesn’t mean as much as in other markets as values can vary so dramatically due to things such as proximity to the beach, views, specific neighborhoods.

Average days on market per month as well as the % of list price that homes sold at. 

A high % indicates a sellers market as home sell at, or above list price.

Average price for listed home sales in relation to the average price for sold homes.

Months of home inventory based on closed home sales. 

Buyer’s market: more than 6 months of inventory  Seller’s market: less than 3 months of inventory  Neutral market: 3 – 6 months of  inventory