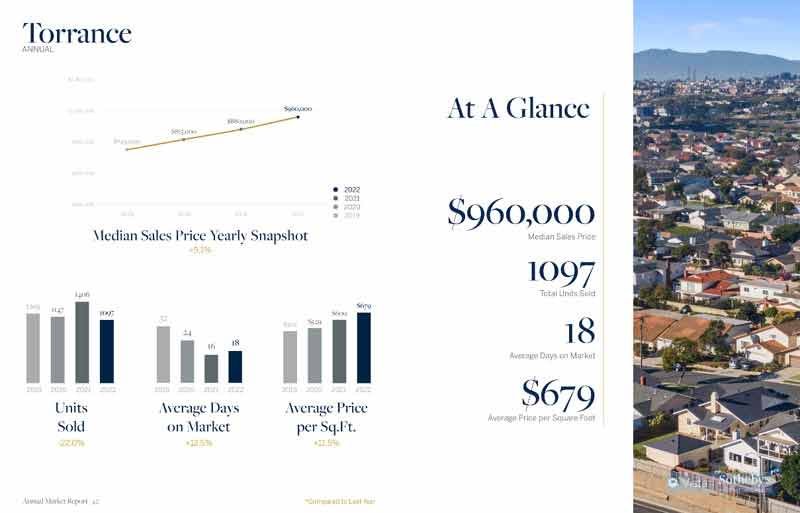
Torrance Real Estate Recap – November at a Glance

Let’s look back at the month that was for real estate in Torrance.  Welcome to the Torrance real estate recap….by the numbers.   Search the actual homes that sold along with the prices.  It was a big month in Torrance real estate with 104 homes closing during the month at a median $868,000.  Homes averaged 15 days on market before going into escrow.

See also the current homes for sale in Torrance CA

Torrance real estate 2022

Torrance Real Estate Market Update – At a Glance

Welcome to our quick real estate recap for April.   Torrance definitely saw a drop in the number of home sales during the month with 81 closed home sales compared with 99 a year earlier.  Compared with many other cities that saw almost a 50% drop from the year earlier this wasn’t bad at all.  The average days on market was a very speedy 24 compared with 37 in 2019.  The median sales price was $792,0000 and the average price per foot was $503.  See more details in our full Torrance real estate trends and statistics area.  See also the Torrance homes that sold in April.

View the current homes for sale in Torrance CA.

Gated community of Breakers at Plaza Del Amo Torrance

Real Estate Recap – Torrance CA Home Sales and Prices for February 2020

February was a slow month for closed home sales in Torrance Calfornia with only 71 homes sold during the month. That’s the fewest home sales in a month over the past 18 months other than December 2018 and 2019 (which is typically very slow) Prices were solid as they’ve been over the past 18 months with the median list prices of $717,500 and a median sales price of $700,000.  Average price per foot for sold homes in Manhattan Beach was $532.  Median days on market was only 13 which is incredibly low and is another indication of a strong sellers market.  Old Torrance saw the most home sales with 10.   See the Torrance real estate stats for the past 15 months below.

View the current homes for sale in Torrance CA

February 2020 Home Sales and Prices in Torrance.

MLS # Type   Address Price $ Per Foot Bed/Bath Sq Feet Year Sold Date
DW19263303 SFR/D 1604 W 226th ST   $510,000 $675.50 2/1,0,0,0 755/A 1952/ASR 2/5/2020
20548890 SFR 21126 Denker AVE   $580,000 $591.23 2/1,0,0,0 981/O 1952 2/26/2020
PW19193695 SFR/D 1302 Harmony WAY   $659,000 $321.46 4/4,0,0,0 2050/A 2007/ASR 2/12/2020
OC20014416 SFR/D 20951 Halldale AVE   $795,000 $519.61 4/2,0,0,0 1530/A 1951/ASR 2/21/2020
SW19148442 SFR/A 21405 S Normandie AVE   $978,990 $364.89 4/4,0,0,0 2683/B 2018/BLD 2/21/2020
SB20022832 TWNHS/A 22330 Harbor Ridge LN   #5 $400,125 $310.90 3/2,0,0,0 1287/A 1980/ASR 2/14/2020
SB20015190 CONDO/A 22232 S Vermont AVE   #203 $405,000 $421.44 2/2,0,0,0 961/A 1985/ASR 2/27/2020
RS19282196 CONDO/A 20553 S Vermont AVE   #1 $420,000 $433.88 2/0,2,0,0 968/A 1982/ASR 2/3/2020
19532922 SFR 21028 Royal BLVD   $520,000 $594.29 2/1,0,0,0 875/ 1954 2/6/2020
SB20014741 SFR/D 1012 Clarion DR   $590,000 $503.41 3/1,1,0,0 1172/A 1959/ASR 2/20/2020
SB20014479 SFR/D 20809 Orchard AVE   $613,000 $523.04 3/2,0,0,0 1172/A 1961/ASR 2/5/2020
OC20016855 SFR/D 912 W 214th ST   $695,000 $408.82 3/1,1,0,0 1700/A 1960/ASR 2/28/2020
SB19273083 SFR/D 23329 Berendo AVE   $800,000 $300.98 5/1,2,0,0 2658/A 1969/ASR 2/11/2020
SB20013550 TWNHS/A 3718 Newton ST   $654,000 $568.70 2/1,1,1,0 1150/A 2010/ASR 2/20/2020
SB20002097 SFR/D 4006 W 242nd ST   $840,000 $889.83 2/1,0,0,0 944/A 1949/ASR 2/25/2020
19531970 CONDO 2605 SEPULVEDA    #201 $455,000 $458.21 1/1,0,1,0 993/ 2003 2/5/2020
SB19271335 CONDO/A 2605 Sepulveda BLVD   #208 $510,000 $428.21 2/1,1,0,0 1191/A 2003/ASR 2/27/2020
SB20017286 SFR/D 2360 Del Amo    $540,000 $830.77 2/1,0,0,0 650/A 1948/ASR 2/21/2020
SB19287069 TWNHS/A 3520 Maricopa ST   #22 $626,000 $453.62 2/1,1,1,0 1380/A 1975/ASR 2/11/2020
PV20010588 TWNHS/A 2800 Plaza Del Amo    #368 $665,000 $561.18 2/2,0,1,0 1185/A 1987/ASR 2/12/2020
SB20013809 CONDO/A 2563 Plaza Del Amo    #412 $680,000 $521.87 2/2,0,0,0 1303/A 1985/ASR 2/14/2020
SB19281927 TWNHS/A 2300 Maple AVE   #58 $781,800 $454.27 3/2,0,1,0 1721/A 1989/ASR 2/13/2020
20543458 TWNHS 2300 MAPLE AVE   #232 $845,000 $452.60 4/3,0,0,0 1867/ 1988 2/19/2020
SB20008579 SFR/D 1017 Teri AVE   $915,000 $527.68 4/1,1,0,0 1734/A 1951/ASR 2/11/2020
SB20001457 TWNHS/D 2889 Plaza Del Amo    #902 $970,000 $424.51 3/2,0,1,0 2285/A 2003/ASR 2/11/2020
SB19225885 CONDO/A 3120 Sepulveda BLVD   #107 $355,000 $440.45 2/1,1,0,0 806/A 2002/ASR 2/21/2020
SB19242404 CONDO/A 22841 Nadine CIR   #B $417,500 $373.77 2/1,1,0,0 1117/A 1963/ASR 2/6/2020
SB20021449 CONDO/A 3120 Sepulveda BLVD   #209 $420,000 $521.09 2/2,0,0,0 806/A 2002/ASR 2/27/2020
PW19211301 CONDO/A 22631 Maple AVE   #A $464,000 $488.42 2/1,0,1,0 950/A 1963/ASR 2/4/2020
SB19132807 CONDO/A 22605 Nadine Circle    #200 $485,000 $501.55 2/1,0,1,0 967/P 1963/PUB 2/3/2020
SB19282413 CONDO/A 22730 Nadine CIR   #A $492,000 $517.89 2/0,1,1,0 950/A 1963/ASR 2/21/2020
SB19214876 CONDO/A 22939 Nadine CIR   #B $510,000 $456.58 2/2,0,0,0 1117/A 1963/APP 2/11/2020
SB20025306 SFR/D 2759 W 234th ST   $944,000 $488.36 4/1,1,0,0 1933/A 1965/ASR 2/27/2020
SB20006563 SFR/D 4621 Greenmeadows AVE   $1,129,000 $721.87 3/1,2,0,0 1564/A 1953/ASR 2/28/2020
SB19250168 SFR/D 5418 Calle De Arboles    $1,345,000 $613.87 4/3,0,0,0 2191/A 1955/ASR 2/27/2020
SB19242072 SFR/D 4111 Paseo De Los Tortugas    $1,550,000 $699.77 4/3,0,0,0 2215/A 1968/ASR 2/28/2020
PV20021775 SFR/D 22644 Gaycrest AVE   $878,000 $1,068.13 2/1,0,0,0 822/A 1952/ASR 2/18/2020
SB20016005 SFR/D 5035 Avenue B    $989,000 $506.66 3/2,0,0,0 1952/A 1952/ASR 2/21/2020
OC19217903 SFR/D 22602 Linda DR   $1,000,000 $599.52 3/2,0,0,0 1668/A 1952/APP 2/12/2020
PV20015739 SFR/D 3928 W 234th PL   $1,075,000 $514.35 4/2,0,0,0 2090/A 1962/ASR 2/27/2020
PV20011715 SFR/D 23517 Adolph AVE   $1,190,000 $516.27 5/3,0,0,0 2305/A 1962/ASR 2/25/2020
SB20003535 SFR/D 5024 Macafee RD   $1,250,000 $537.17 3/3,0,0,0 2327/A 2000/ASR 2/13/2020
SB20011927 SFR/D 5020 Laurette ST   $1,130,000 $571.00 4/2,0,0,0 1979/A 1955/ASR 2/25/2020
SB20015221 SFR/D 19413 Donora AVE   $965,000 $839.13 3/1,0,0,0 1150/A 1955/ASR 2/20/2020
SB19147236 SFR/D 3713 W 181st ST   $625,000 $562.05 3/1,0,0,0 1112/A 1953/PUB 2/12/2020
TR19191215 SFR/D 18603 Crenshaw BLVD   $645,000 $739.68 3/1,0,0,0 872/A 1951/ASR 2/12/2020
SB19278883 SFR/D 18301 Patronella AVE   $797,000 $440.33 3/2,0,0,0 1810/A 1954/ASR 2/19/2020
SB19259179 SFR/D 3806 W 172nd ST   $875,000 $570.03 3/2,0,0,0 1535/A 1955/ASR 2/10/2020
SB20020606 SFR/D 17202 Falda AVE   $880,000 $425.33 3/2,0,0,0 2069/A 1948/ASR 2/26/2020
DW19281919 SFR/D 18035 Fonthill AVE   $926,000 $315.07 5/4,0,0,0 2939/A 1954/ASR 2/25/2020
SB20003030 SFR/D 3355 W 175th ST   $940,000 $505.38 3/2,0,0,0 1860/A 1950/APP 2/14/2020
SB19227558 SFR/D 18808 Van Ness AVE   $692,500 $451.43 3/1,1,0,0 1534/A 1951/ASR 2/21/2020
SB20008812 SFR/D 2055 W 185th ST   $700,000 $527.51 3/2,0,0,0 1327/A 1955/ASR 2/20/2020
SB20000008 SFR/D 18151 GRAMERCY PL   $779,000 $641.15 3/1,1,0,0 1215/A 1957/ASR 2/28/2020
SB19283904 SFR/D 2521 W 168th ST   $810,000 $537.49 3/2,0,0,0 1507/A 1953/PUB 2/11/2020
DW19287241 CONDO/A 1281 Cabrillo AVE   #302 $410,000 $676.57 1/1,0,0,0 606/A 1993/ASR 2/28/2020
PW19134808 CONDO/A 911 Cota AVE   #2 $475,000 $409.84 2/3,0,0,0 1159/A 1984/APP 2/21/2020
SB20014462 SFR/D 2019 W 220th ST   $587,500 $807.01 2/1,0,0,0 728/A 1930/PUB 2/28/2020
DW19267326 SFR/D 2418 Del Amo BLVD   $625,000 $686.81 3/1,0,0,0 910/A 1948/ASR 2/11/2020
PW20001578 TWNHS/A 1833 Cabrillo AVE   $690,000 $575.00 2/2,0,1,0 1200/A 2011/ASR 2/13/2020
SB20002581 SFR/D 617 Cota AVE   $726,000 $639.08 3/1,0,0,0 1136/A 1919/ASR 2/27/2020
SB19264034 SFR/D 606 Amapola AVE   $740,000 $811.40 2/2,0,0,0 912/A 1947/ASR 2/5/2020
SB20009557 SFR/D 2362 Sierra ST   $818,000 $464.77 3/2,0,1,0 1760/A 1988/ASR 2/21/2020
SB19245968 SFR/D 1729 Manuel AVE   $875,000 $498.29 4/1,0,1,0 1756/A 1950/ASR 2/28/2020
TR20005423 SFR/D 2405 Santa Cruz CT   $986,300 $377.03 4/3,0,0,0 2616/A 1977/ASR 2/19/2020
CV19232342 TWNHS/A 23903 Arlington AVE   $490,000 $462.26 2/1,1,0,0 1060/A 1978/ASR 2/26/2020
SB19257855 CONDO/A 23418 Arlington AVE   #1 $540,000 $385.44 3/1,1,0,1 1401/A 1973/ASR 2/24/2020
SB20009491 SFR/D 2269 W 233rd ST   $850,000 $361.09 4/3,0,0,0 2354/A 1978/ASR 2/26/2020
SB20008302 SFR/D 2338 W 232nd ST  W $879,000 $529.84 3/2,0,0,0 1659/A 1973/ASR 2/20/2020
DW19216620 CONDO/A 20425 S Vermont AVE   #4 $380,000 $396.25 2/2,0,0,0 959/A 1980/ASR 2/14/2020
PW19266283 SFR/A 1655 W 216th ST   $740,000 $508.24 4/2,0,0,0 1456/A 1944/ASR 2/7/2020

By the Number – Real Estate Stats for Torrance CA

View all real estate stats for Torrance

111 Homes Sales in Torrance for December 2017

Torrance California saw a pretty typical and solid month finishing out 2017.  The median home price was $670,000 for the South Bay’s largest city which was a slight increase from $650,000 in December the year prior.  There were another month of impressive sales, with 111 homes sold during the month.  This is slightly lower than normal but not unusal for December.  Click here to see the current homes for sale in Torrance or view our recent home sales in Torrance CA.

City Homes Sold December 2017  Median December 2016  Median Year
over Year % Change%
Carson 47 $486,000 $451,000 7.8%
El Segundo 11 $966,000 $985,000 -2%
Gardena 65 $515,00 $465,000 10.8%
Harbor City 17 $572,000 $621,000 -7.9%
Hawthorne 30 $545,000 $555,000 -1.9%
Hermosa Beach 15 $2,003,000 $1,440,000 39.1%
Lawndale 12 $448,000 $510,000 -12.3%
Lomita 10 $595,000 $519,000 14.5%
Long Beach 284 $497,000 $465,000 6.9%
Manhattan Beach 36 $2,250,000 $1,790,000 25.7%
Marina Del Rey 31 $1,075,000 $841,000 27.9%
Palos Verdes Estates 27 $1,342,000 $1,599,000 -16.1%
Playa Del Rey 9 $612,000 $588,000 4.2%
Rancho Palos Verdes 58 $1,050,000 $1,170,000 -10.3%
Redondo Beach 78 $1,018,000 $987,000 3.1%
San Pedro 58 $485,000 $515,000 -5.8%

Torrance

111

$670,000

$650,000

3.1%

Westchester 38 $1,005,000 $985,000 2%


Torrance CA Home Prices Continue to Rise in December

By Keith KyleSold Sign Torrance

The December numbers are in and if there was any thought that the real estate market in Torrance was slowing down or leveling the numbers certainly say otherwise.

The average home price in Torrance for the homes that closed escrow during December was $620,851* with a median price of $619,000*.  Those are big numbers that still shows no sign of slowing or reversing.   See the chart below for the December home sales numbers for Torrance and the South Bay for December of 2015.

*Based on MLS sales only.  Does not include off market sales information

City Homes
Sold
December
2015 Median
December
2014 Median
Year
over Year % Change
Carson  73 $360,000 $365,000 -1.4%
El Segundo 10 $949,000 $735,000 20.2
Gardena 41 $420,000 $385,000 9.1%
Harbor City 15 $483,000 $467,000 9.1%
Hawthorne 35 $508,500 $667,750 -23.8%
Hermosa Beach 24 $1,475,000 $1,360,000 8.5%
Lawndale 13 $420,000 $415,000 1.2%
Lomita 16 $520,000 $490,000 6.1%
Long Beach 339 $456,000 $395,000 15.4%
Manhattan Beach 34 $2,184,000 $1,689,000 29.3%
Marina Del Rey 31 $905,000 $759,000 19.2%
Palos Verdes Estates 29 $1,456,000 $1,150,000 26.7%
Playa Del Rey 17 $605,000 $482,000 25.5%
Rancho Palos Verdes 48 $1,170,000 $1,135,000 3.1%
Redondo Beach 89 $836,250 $770,000 7.3%
San Pedro 72 $517,500 $492,000 5.2%
Torrance 122 $619,000 $562,000 10.1%
Westchester 34 $951,000 $807,500 17.8%

CONTACT US

for all of your Torrance real estate services

your torrance realtor

Torrance realtor Keith Kyle
Keith Kyle
Realtor

DRE#01712785

Vista Sotheby's logo

REALESTATETORRANCE – All rights reserved – Designed and Developed by Keith Kyle Homes