4 Bedroom Home in Walteria Torrance Hits the Market at 2707 Grand Summit

The real estate market numbers are in for May and they paint a very interesting picture. The number of home sales during the month was way down with only 49 total on market closed escrows. Compare that with 123 home sales in May of 2019 and it’s hard to dispute that the concerns and uncertainties of the coronavirus hasn’t had a major impact. That being said the prices were very impressive indicating a very strong seller’s market.
The median list price was $789,900 while the median sold price was $810,000 meaning that most homes sold well higher than the list or asking price. Average price per foot was $527.14. The average days on market was 40 before going into escrow while the median days on market was a very short 10 days.
View the current Torrance homes for sale
|
MLS#
|
Type
|
Address |
Price
|
$ Per Foot
|
Bed/Bath
|
Sq Feet
|
Year
|
Sold Date
|
|
|
PW20061930
|
TWNHS/A
|
1520 W | 227th ST #6 |
$497,500
|
$371.27
|
3/2,0,1,0
|
1340/A
|
2007/PUB
|
5/1/2020
|
|
SB20042729
|
SFR/D
|
1565 W | 220th ST |
$685,000
|
$526.92
|
3/2,0,0,0
|
1300/P
|
1944/PUB
|
5/12/2020
|
|
CV20030647
|
SFR/D
|
1410 | Torrance BLVD |
$690,000
|
$403.51
|
3/2,0,0,0
|
1710/A
|
1956/ASR
|
5/4/2020
|
|
SW20013553
|
SFR/D
|
21315 S | Normandie AVE |
$906,990
|
$476.36
|
4/3,0,0,0
|
1904/B
|
2019/BLD
|
5/18/2020
|
|
SB20052637
|
CONDO/A
|
838 | Coriander DR #D |
$290,000
|
$453.83
|
1/1,0,0,0
|
639/P
|
1973/PUB
|
5/29/2020
|
|
SB19277187
|
CONDO/A
|
23312 | Marigold AVE #T204 |
$410,000
|
$384.62
|
3/2,0,0,0
|
1066/A
|
1973/ASR
|
5/1/2020
|
|
SB20050583
|
SFR/D
|
20811 | Doble AVE |
$630,000
|
$484.62
|
3/2,0,0,0
|
1300/A
|
1960/ASR
|
5/1/2020
|
|
SB20072389
|
SFR/D
|
21312 | Payne Ave |
$635,000
|
$490.35
|
3/2,0,0,0
|
1295/A
|
1960/ASR
|
5/27/2020
|
|
20561844
|
TWNHS
|
3090 | Newton ST |
$810,000
|
$437.37
|
2/2,0,1,0
|
1852/
|
2003
|
5/15/2020
|
|
PV20039796
|
TWNHS/A
|
3922 W | 242nd ST |
$861,000
|
$570.58
|
3/2,0,0,1
|
1509/B
|
2020/BLD
|
5/22/2020
|
|
PV20016706
|
TWNHS/A
|
3918 W | 242nd ST |
$935,000
|
$598.21
|
3/3,0,0,0
|
1563/B
|
2020/SLR
|
5/7/2020
|
|
SB19234953
|
TWNHS/A
|
3534 | Emerald ST |
$475,000
|
$599.75
|
2/1,0,0,0
|
792/A
|
1985/ASR
|
5/15/2020
|
|
SB20047379
|
COOP/A
|
3115 | Merrill DR #44 |
$485,000
|
$309.51
|
3/1,1,0,0
|
1567/E
|
1963/PUB
|
5/13/2020
|
|
SB20023026
|
CONDO/A
|
1745 | Maple AVE #45 |
$576,000
|
$338.82
|
3/2,0,0,0
|
1700/T
|
1963/ASR
|
5/5/2020
|
|
SB20056313
|
TWNHS/A
|
2595 | Plaza Del Amo #420 |
$743,000
|
$519.94
|
2/2,0,1,0
|
1429/A
|
1987/ASR
|
5/4/2020
|
|
SB20033195
|
TWNHS/A
|
3468 | Del Amo BLVD |
$757,300
|
$453.47
|
4/2,0,1,0
|
1670/A
|
1974/ASR
|
5/6/2020
|
|
SB20057470
|
SFR/D
|
1316 | Cordary AVE |
$854,000
|
$540.51
|
3/1,1,0,0
|
1580/A
|
1951/PUB
|
5/29/2020
|
|
SB20018489
|
SFR/D
|
4902 | Pacific Coast |
$989,000
|
$658.89
|
3/0,2,0,0
|
1501/A
|
1953/ASR
|
5/6/2020
|
|
SB20067312
|
SFR/D
|
4817 | Zakon RD |
$900,000
|
$777.20
|
3/1,0,1,0
|
1158/A
|
1956/ASR
|
5/12/2020
|
|
SB20028943
|
SFR/D
|
5133 | Macafee RD |
$928,000
|
$705.70
|
3/1,1,0,0
|
1315/S
|
1949/ASR
|
5/20/2020
|
|
SB19274713
|
SFR/D
|
24005 | Los Codona AVE |
$935,000
|
$377.02
|
4/3,0,1,0
|
2480/A
|
2001/ASR
|
5/1/2020
|
|
SB20053113
|
SFR/D
|
23003 | Evalyn AVE |
$945,000
|
$624.59
|
3/2,0,0,0
|
1513/A
|
1954/ASR
|
5/6/2020
|
|
OC20068314
|
SFR/D
|
4146 W | 229th ST |
$950,000
|
$564.13
|
4/3,0,0,0
|
1684/E
|
1968/ASR
|
5/29/2020
|
|
PV20055168
|
SFR/D
|
4418 W | 233rd ST |
$1,140,000
|
$583.42
|
4/2,0,0,0
|
1954/A
|
1960/ASR
|
5/1/2020
|
|
SB20076678
|
SFR/D
|
23202 | Ladeene AVE |
$1,150,000
|
$608.47
|
4/2,0,0,0
|
1890/A
|
1960/ASR
|
5/27/2020
|
|
SB20078065
|
CONDO/A
|
5500 | Torrance BLVD #C231 |
$647,500
|
$506.25
|
3/2,0,0,0
|
1279/A
|
1990/ASR
|
5/29/2020
|
|
SB20068601
|
SFR/D
|
4302 | Lenore ST |
$850,000
|
$673.00
|
4/2,0,0,0
|
1263/A
|
1956/ASR
|
5/29/2020
|
|
IV20053830
|
SFR/D
|
21301 | Marjorie AVE |
$900,500
|
$496.96
|
3/1,2,0,0
|
1812/P
|
1956/PUB
|
5/13/2020
|
|
SB20058366
|
SFR/D
|
21601 | Redbeam AVE |
$915,000
|
$624.15
|
4/2,0,0,0
|
1466/A
|
1955/PUB
|
5/1/2020
|
|
SB20064702
|
SFR/D
|
4636 | Bulova ST |
$815,000
|
$732.91
|
3/1,0,0,0
|
1112/A
|
1954/ASR
|
5/5/2020
|
|
SB20057420
|
SFR/D
|
19517 | Beckworth AVE |
$830,000
|
$750.45
|
3/1,0,0,0
|
1106/A
|
1955/ASR
|
5/13/2020
|
|
SB20048503
|
TWNHS/D
|
4126 | Spencer ST |
$878,000
|
$485.62
|
3/2,0,1,0
|
1808/A
|
2004/ASR
|
5/18/2020
|
|
SB20089850
|
SFR/D
|
5129 | Towers ST |
$889,000
|
$694.53
|
3/1,0,0,0
|
1280/A
|
1954/ASR
|
5/29/2020
|
|
SB20056899
|
SFR/D
|
5618 | Sara DR |
$1,331,000
|
$577.44
|
4/2,1,1,0
|
2305/A
|
1959/ASR
|
5/12/2020
|
|
DW20075598
|
SFR/D
|
3424 W | 182nd ST |
$544,000
|
$451.45
|
3/2,0,0,0
|
1205/A
|
1956/ASR
|
5/29/2020
|
|
SB20066595
|
SFR/D
|
17002 | Glenburn AVE |
$700,000
|
$650.56
|
3/1,0,0,0
|
1076/A
|
1948/PUB
|
5/20/2020
|
|
SB20063842
|
SFR/D
|
4038 W | 176th ST |
$767,600
|
$510.71
|
3/0,2,0,0
|
1503/A
|
1952/ASR
|
5/8/2020
|
|
SB20073281
|
SFR/D
|
4315 W | 176th ST |
$830,000
|
$484.25
|
3/2,0,1,0
|
1714/A
|
1952/ASR
|
5/21/2020
|
|
MB20075692
|
SFR/D
|
21319 | Berendo AVE |
$530,000
|
$409.27
|
3/2,0,0,0
|
1295/A
|
1959/ASR
|
5/15/2020
|
|
SB20061751
|
SFR/D
|
16107 | Van Ness AVE |
$665,000
|
$449.93
|
4/1,1,0,0
|
1478/A
|
1956/ASR
|
5/14/2020
|
|
PW20068122
|
SFR/D
|
1948 W | 187th PL |
$693,000
|
$550.00
|
3/1,1,0,0
|
1260/A
|
1958/ASR
|
5/19/2020
|
|
SB20037460
|
SFR/D
|
17315 | Atkinson AVE |
$717,000
|
$616.51
|
3/2,0,0,0
|
1163/A
|
1947/ASR
|
5/7/2020
|
|
SB20063236
|
SFR/D
|
18312 | Wilton PL |
$875,000
|
$538.79
|
3/2,0,0,0
|
1624/A
|
1962/ASR
|
5/22/2020
|
|
SB20048696
|
SFR/D
|
2139 | Del Amo BLVD |
$775,000
|
$394.20
|
5/3,0,0,0
|
1966/A
|
1996/ASR
|
5/19/2020
|
|
SB20072657
|
CONDO/A
|
22734 | Cypress ST |
$615,000
|
$447.60
|
3/3,0,0,0
|
1374/A
|
1974/ASR
|
5/29/2020
|
|
SB20074635
|
SFR/D
|
1719 W | 239th ST |
$747,000
|
$576.39
|
3/2,0,0,0
|
1296/A
|
1956/ASR
|
5/27/2020
|
|
SR20074960
|
SFR/D
|
23811 | Huber AVE |
$780,000
|
$601.85
|
3/2,0,0,0
|
1296/A
|
1956/ASR
|
5/27/2020
|
|
PV20077152
|
SFR/D
|
2359 W | 230th ST |
$879,000
|
$407.13
|
4/2,0,0,0
|
2159/T
|
1971/ASR
|
5/28/2020
|
|
PW20042087
|
SFR/D
|
2217 W | 234th ST |
$1,155,000
|
$340.71
|
4/3,0,0,0
|
3390/A
|
1991/ASR
|
5/8/2020
|
Welcome to our Torrance real estate update for the coming year. 2020 is looking to be another banner year for home sellers as the combination of seemingly endless demand and historically low interest rates means more people will be looking to purchase a home.
View the current homes for sale in Torrance California.
In general the real estate market seems to be slowing down heading into 2020 but for a very odd reason…..each month there are fewer homes hitting the market. Fewer listings mean fewer home sales. January saw a very slight uptick in the number of listings so we’re hopeful that is a trend that continues. Other than that small bump in January, the number of homes for sale has dropped every month since May of 2019
According to Torrance realtor Keith Kyle, “It’s clear that the market is cooling off as there has been an increase in new listings coupled with fewer sales and homes going into escrow since summer.” The chart above shows that the number of active listings has held pretty steady between 150 and 170 since summer, but the number of sold homes as well as new escrows has continued to decrease. If this trend continues the market will shift more in favor of buyers and less in favor of sellers. It’s clearly been a sellers market over the past few years.
The chart below shows the upward trend over the past few months with avarage “months of inventory” of unsold homes on the rise.
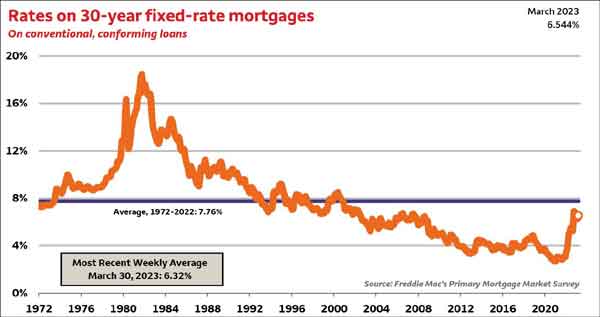
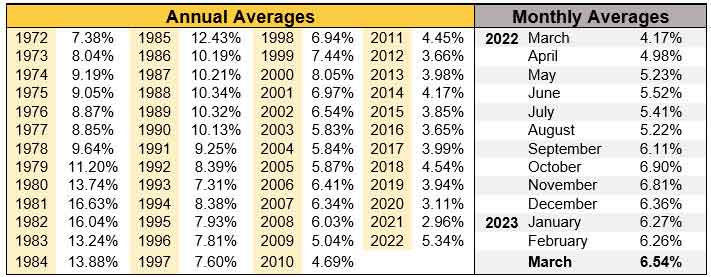
Many Torrance CA buyers are concerned with interest rates rising with the Fed making it clear that rates will slowly increats. That’s certainly a valid concern for potential Torrance homebuyers as a higher interest rate means a higher monthly payment which most often means a lower priced home. Taken in historical standpoint the current rates are dramatically lower than at just about any other time. The chart below shows the interest rate on conventional and conforming 30 year fixed rate mortgages. As we’ll see we’ve basically seen rates drop consistently since the high water mark of 16.3% in 1981. It certainly makes todays current rate in the mid 4% range seem pretty enticing.
Torrance, CA saw a slight gain in year over year home prices in May with 138 homes sold this month at a median price of around $593,000 which was up from $579,000 the prior May. 138 homes is a very strong number for Torrance and shows that the market activity is continuing to pick up with more homes slowly coming on the market. Click here to see the homes sold in Torrance for May of 2016.
| City | Homes Sold |
May 2016 Median |
May 2015 Median |
Year over Year % Change% |
| Carson | 57 | $453,000 | $410,000 | 10.4% |
| El Segundo | 12 | $802,500 | $803,500 | -.1% |
| Gardena | 47 | $425,000 | $405,000 | 4.9% |
| Harbor City | 26 | $439,000 | $415,000 | 5.8% |
| Hawthorne | 39 | $485,000 | $525,000 | -7.7% |
| Hermosa Beach | 21 | $1,285,000 | $1,450,000 | -11.4% |
| Lawndale | 14 | $455,000 | $431,000 | 5.6% |
| Lomita | 15 | $488,000 | $509,000 | -4.1% |
| Long Beach | 349 | $485,000 | $433,000 | 11.9% |
| Manhattan Beach | 48 | $1,875,000 | $2,239,000 | -16.2% |
| Marina Del Rey | 31 | $925,000 | $918,000 | .8% |
| Palos Verdes Estates | 55 | $1,499,000 | $1,515,000 | -1.1% |
| Playa Del Rey | 24 | $560,000 | $615,000 | -8.9% |
| Rancho Palos Verdes | 58 | $1,060,000 | $1,100,000 | -3.6% |
| Redondo Beach | 96 | $950,000 | $845,000 | 12.5% |
| San Pedro | 66 | $489,000 | $449,000 | 8.8% |
| Torrance | 138 | $593,000 | $579,000 | 2.4% |
| Westchester | 30 | $1,130,000 | $900,000 | 25.6% |