See Torrance CA Home Prices for May 2017

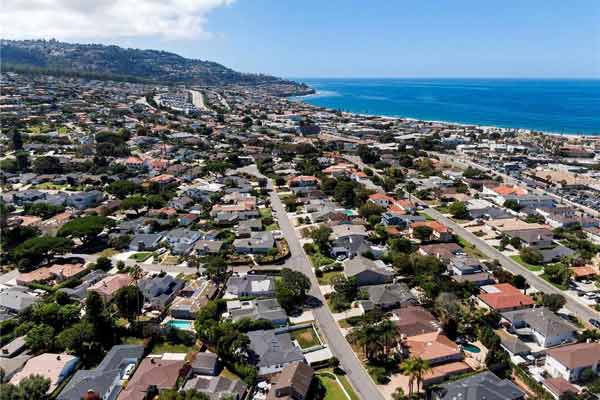
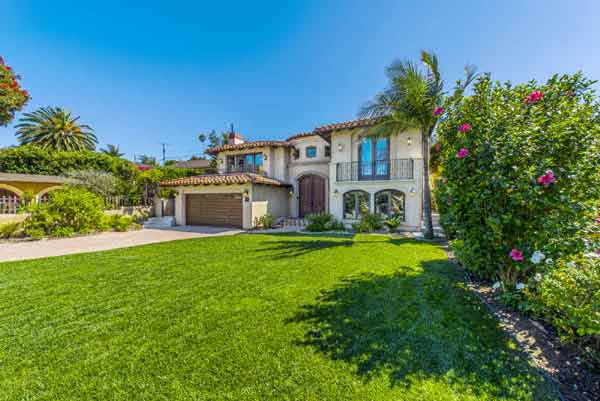
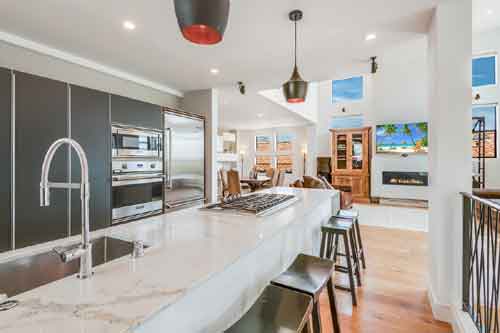
Torrance saw a big increase in the monthly number of home sales in May 2017 with 140 homes closing escrow.  The median home price was an impressive $690,000 for the month.  See the Torrance CA real estate market trends and statistics here.  To see the homes that sold in Torrance CA for May visit our home sales page.

City Homes
Sold
May 2017 Median May 2016 Median Year over Year % Change%
Carson 41 $458,000 $453,000 1.2%
El Segundo 8 $880,000 $803,000 9.7%
Gardena 65 $523,000 $425,000 23.1%
Harbor City 14 $503,000 $439,000 14.5%
Hawthorne 46 $610,000 $485,000 25.8%
Hermosa Beach 26 $1,738,000 $1,285,000 35.3%
Lawndale 16 $485,000 $455,000 6.5%
Lomita 18 $653,000 $488,000 33.7%
Long Beach 356 $472,000 $485,000 -2.6%
Manhattan Beach 46 $2,175,000 $1,875,000 16%
Marina Del Rey 32 $933,000 $925,000 0.8%
Palos Verdes Estates 47 $1,650,000 $1,499,000 10.1%
Playa Del Rey 31 $720,000 $560,000 28.6%
Rancho Palos Verdes 51 $1,275,000 $1,060,000 20.3%
Redondo Beach 87 $1,054,000 $950,000 10.9%
San Pedro 63 $620,000 $489,000 26.8%
Torrance 140 $690,000 $593,000 16.4%
Westchester 44 $965,000 $1,130,000 -14.6%
South Redondo Beach and the Hollywood Riviera

New Real Estate Website for Home Buyers and Sellers in the Hollywood Riviera

With the individual real estate markets in the South Bay being so diverse and specialized, the larger real estate sites and portals just can’t focus on specific neighborhoods.  We are proud to announce the Hollywood Riviera real estate website HomesinHollywoodRiviera.com which will provide home buyers and sellers insight into this localized market.   From the current homes for sale and MLS listings, to determining the value of homes in the area, to finding realtors that specialize in the real estate market of the Hollywood Riviera, we hope the site is an invaluable resource for all things real estate in this wonderful coastal community.

Homes for sale in the Hollywood Riviera

When Days on Market Doesn’t Necessarily Represent the Days on Market

By Keith Kyle

I’m sure most MLS systems are different but here in the South Bay the days on market on the CRMLS can be a bit misleading.  Many buyer and agents use days on market as a negotiating tool….the longer the home has been on the market, the more leverage the buyer has to come in low or negotiate other favorable terms.

The problem is that days on market doesn’t always indicate just how long the home has been available and is not necessarily indicative of “active” status.  As realtors when our clients accept an offer we have the option of changing the status to “pending” or “active under contract”.  Pending stops the days on market from accruing, but active under contract does not.  A home can go into escrow on day one, change the status to active under contract (again meaning it’s in escrow) and if it falls out of escrow 20 days later the days on market for the home will show 20.  It’s very misleading as the home has not been available for those 20 days and now puts the seller and listing agent at a disadvantage…..even though it sold the first day.

The other aspect that leads to misinformation is that with this days on market accruing on many home, it does not allow for an accurate picture of the market.  For instance a certain area of town or city itself may show an average days on market for a certain month to be one thing….when many of those homes were not actually available.  It may show days on market at 45 when the reality is that the homes in the community actually go into escrow after 30.

It’s a problem that needs to be addressed as it can change perceptions….both on an individual home and the market in general.

Torrance Home Sales and Housing Prices for November 2016

By Keith Kyle

Torrance, CA posted some solid home sales numbers in November 2015 with a very healthy 112 homes selling at a median price of $656,000 which was up considerably over November of the previous year.  To see the home sales in Torrance click here.  Torrance is one of the largest cities in the South Bay with a very diverse housing market.

City Homes
Sold
November
2016 Median
November
2015 Median
Year
over Year % Change%
Carson 54 $450,000 $420,000 7%
El Segundo 14 $816,000 $1,171,000 -30.3%
Gardena 44 $504,000 $413,000 22%
Harbor City 9 $523,000 $404,000 29.5%
Hawthorne 37 $575,000 $520,000 10.6%
Hermosa Beach 17 $1,380,000 $1,625,000 -15%
Lawndale 8 $393,000 $521,000 -24.6%
Lomita 6 $473,000 $535,000 -11.6%
Long Beach 298 $490,000 $435,000 12.6%
Manhattan Beach 38 $1,863,000 $1,831,000 1.7%
Marina Del Rey 21 $955,000 $945,000 1.1%
Palos Verdes Estates 25 $1,550,000 $1,675,000 -7.5%
Playa Del Rey 20 $658,000 $612,000 7.5%
Rancho Palos Verdes 47 $1,088,000 $945,000 15.1%
Redondo Beach 75 $900,000 $855,000 5.3%
San Pedro 58 $515,000 $485,000 6.3%
Torrance 112 $656,000 $585,000 12.1%
Westchester 32 $943,000 $892,000 5.7%

See the Torrance Sold Homes for September 2016

September was a strong month for home sales in Torrance CA and the South Bay.  Click any link below to see a list of the homes that sold that month or visit our recent South Bay home sales page to see any month and any city in the area.  We hope that the information is helpful and please do not hesitate to contact us for any of your real estate needs.

 September 2016 Home Sales

El Segundo
Gardena
Hawthorne
Hermosa Beach
Hollyglen & Del Aire
Hollywood Riviera
Lawndale
Manhattan Beach
Palos Verdes Estates
Rancho Palos Verdes
Redondo Beach
Rolling Hills Estates
San Pedro
Torrance

Torrance real estate map

What makes the Torrance real estate market so unique?

By Keith Kyle

People often think of the South Bay as one large market but each individual city can mean an entirely different real estate market….just take a look at the monthly median home prices in the South Bay as an indication.

Each city is it’s own real estate market but Torrance is different.  As Torrance is the largest city in the South Bay it’s also the most diverse.  That’s especially true in terms of real estate and home values in Torrance.

What make Torrance so different is the variety of areas, and the diversity of both the homes and the prices.  Torrance is a city that has multi million dollar homes along the Bluff on Paseo De La Playa and also has some of the most affordable homes in all of the South Bay.

Search Torrance homes by area.

The sheer size of Torrance also makes a difference.  Stretching all the way from the ocean to east of the 110 freeway makes for an abundance of options not possible in any other city in the area.  This also allows for everything from single family homes, to condos to even co-ops (rarely seen in the South Bay).

It is definitely not a seen one seen em all type real estate market.

Torrance real estate map