
As Interest Rates Rise….how Does it Impact Torrance Home Buyers?
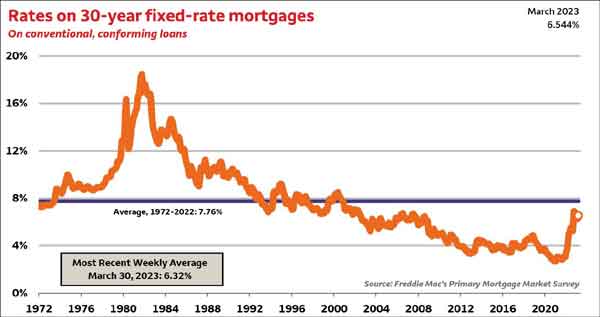
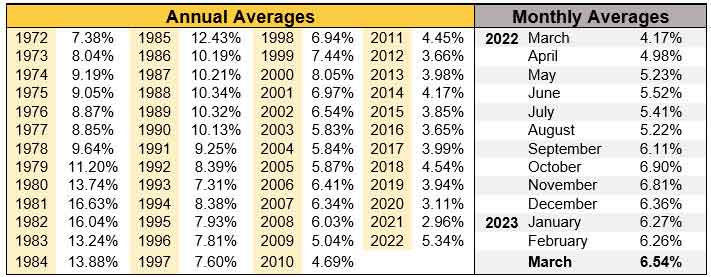
Many prospective home buyers are concerned with rising interest rates. While the Torrance interest rates in 2018 are still historically very low, the concern is justified. Higher interest rates mean reduced buying power. With every slight rise in interest rates, the monthly payment increases reducing the price of a home that a buyer can qualify for. See the chart below for an idea of how different interest rates impact monthly payment and what a buyer’s income needs to be to qualify.
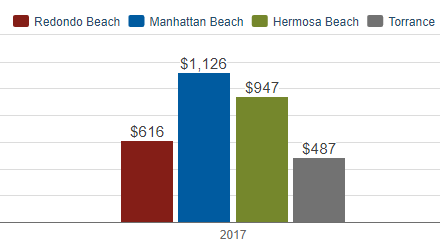
 trended up from the previous year in terms of median home prices with only a few local cities seeing a decrease in y over year prices.
 norm but there was really no sense to it with some cities seeing major increases over June of 2016 and some seeing just as major drops in home prices.