Torrance Alternative: Remodeled Single Family at 6439 Denmead
**UPDATE – This home sold in 2018 and is no longer for sale
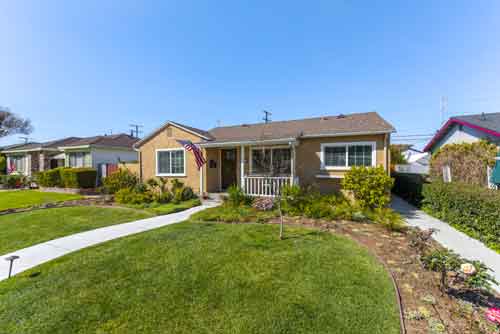
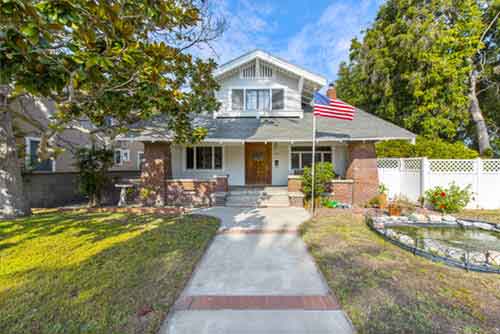
6439 Denmead, Lakewood CA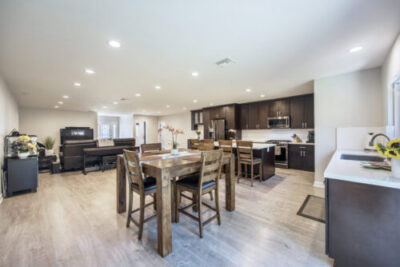
This is the home you have been looking for. From the moment you enter you’re struck by the bright and open concept layout perfect for today’s lifeastyle. The home was recently expanded and extensively remodeled with no expense spared. Enter through the beautiful glass front doors inset with decorative iron and into the expansive living room. You are immediately struck by a sense of space found in only luxury homes. This custom redesign and remodel was inspired by the California lifestyle with open spaces and direct access to the oversize yard and patio with indoor outdoor living in mind.
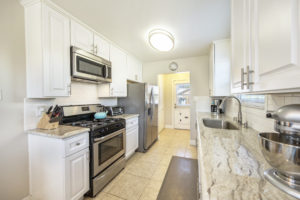
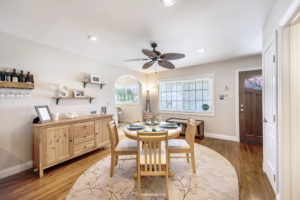
The living room area opens directly to the kitchen and dining areas as well as the sliders to the backyard. The kitchen is the true showcase of
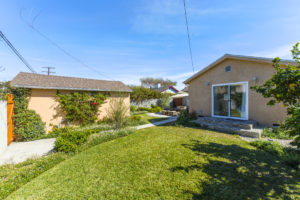
the home with quartz countertops, gleaming cabinetry, oversized kitchen island, black stainless steel appliances and custom LED lighting. Perfect for entertaining, the kitchen offers plenty of room for family gatherings and neighborhood get togethers. Sliders just off of the dining area make for the easy enjoyment of the great yard and patio areas and make for perfect indoor outdoor living. The huge backyard offers an abundance of space from the large grassy yard to the mature avocado, tangerine, dwarf lemon, dwarf orange, persimmon trees to the raised garden bed.
- Priced at $715,000
- 3 Bedroom + office, 2 1/2 Bath
- 1,850 Sq Feet
- Huge 8000+ foot lot
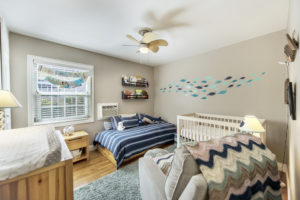
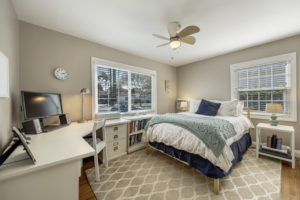
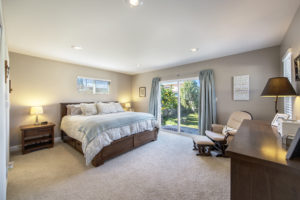
With no direct neighbors off of the backyard the yard enjoys a fantastic level of privacy. The home offers 3 spacious bedrooms including the beautiful master suite. Enjoying great light with an abundance of windows and doors fronting the yard, the master suite offers the perfect retreat. Dazzling master bath features include dual vanities, separate tub and frameless rain shower. The additional two bedroom face the front of the home allowing great light and airflow with beautiful flooring, large windows and brushed nickel ceiling fans. Hall bath enjoys beautiful tile work, frameless glass shower/tub and more. Additional details in this wonderful home include a separate laundry room, power room off of the living area, large office area, new air conditioning unit, tankless water heater, solar power, and a two car detached garage.
Contact listing agent Keith Kyle with Vista Sotheby’s International Realty for more information or for a private showing.