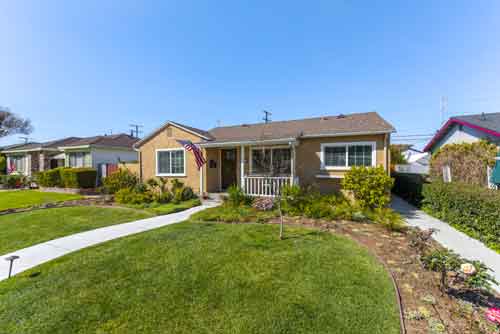
1108 Harper Redondo Beach – Just Listed in the Golden Hills of North Redondo
**Update**This is an older post and this home sold in 2018 and is no longer or sale. Click here to see the current homes for sale in the Golden Hills neighborhood of north Redondo Beach.
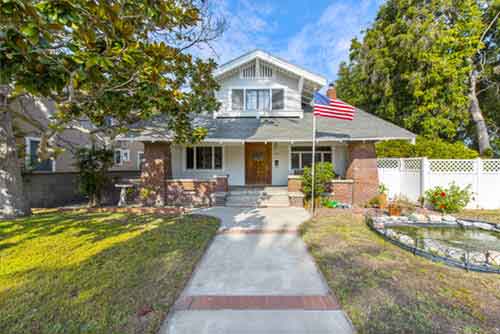
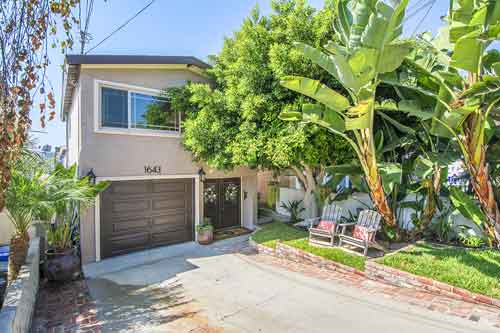
1108 Harper, Redondo Beach CA 90278
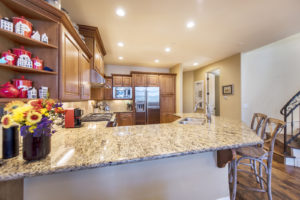
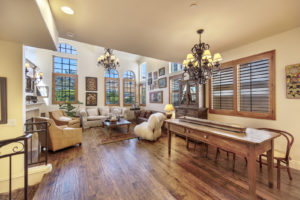
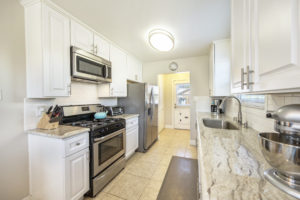
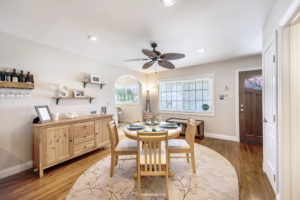
Extra high living room windows with western exposure bathes the large living room in natural light. The main level features solid hickory,
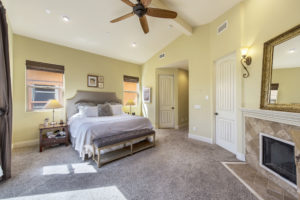
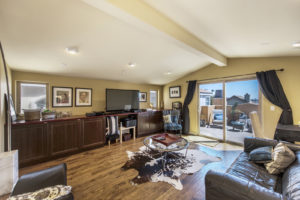
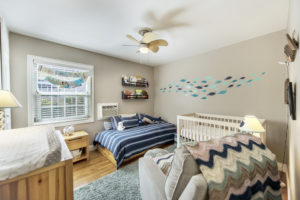
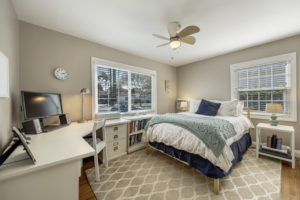
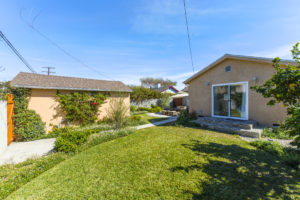
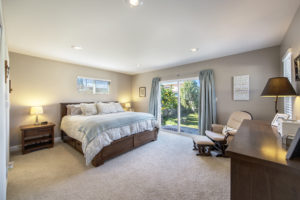
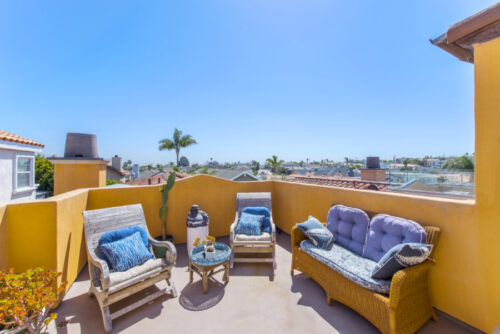
distressed hardwood floors, gas fireplace, recessed lights, & gourmet kitchen with granite counters, stainless appliances, 6 burner stove, & ample cabinet and counter space. The open floorplan and high ceilings adds to the sense of space and light. The spacious master suite offers a corner fireplace, private balcony, large windows, walk in closets and the luxurious bath features a spa tub, separate shower, dual sinks & more. First floor offers 2 large bedrooms and direct access to the private and tranquil backyard patio. What make the home truly unique is the very large 3rd floor mezzanine perfect for a playroom, office, den & more. Off of the mezzanine sits a private roof deck perfect for evening sunsets with panoramic city views. At almost 2200 feet this home offers far more space than your traditional Golden Hills home and is awaiting it’s new owner to make it their own. Contact listing agent Keith Kyle with Vista Sotheby’s International Realty for more information or a private tour.
This is not your typical Golden Hills home. Offering a unique and open layout with soaring ceilings, 3rd floor mezzanine/office overlooking the living room & private roof deck with panoramic city and mountain views, this beautiful home has features rarely seen in Redondo. Located in the highly sought after Jefferson elementary district and just steps from Hermosa Beach, 1108 Harper offers an open layout with all of the bells and whistles of newer construction.
- Priced at $1,399,000
- 2,160 Square Feet
- Built in 2010
- 3 Bed + Office, 3 Bath
- Rooftop deck, master bedroom balcony, private backyard patio