Redondo Beach homes for sale - Ford

November 2017 Median Home Prices in Torrance, CA

November 2017 was a solid month for home sales in Torrance, CA. 

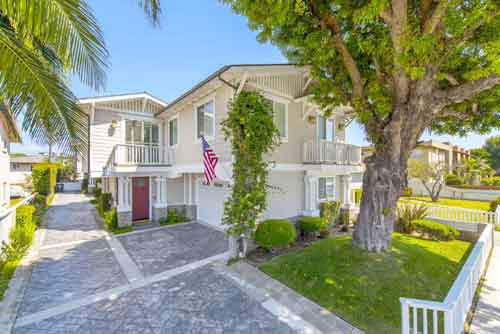
There were 117 homes, townhomes, condos and multi unit properties sold  in the month at a median home price of $700,000 which was a 6.6% increase from the same month a year earlier.  The number of sales was down slighty from October which saw 127 homes sell.

The lowest price of the month was $265,000 for a one bedroom condo with the highest priced sale of the month being $1,550,000 for a 4 bedroom single family home in South Torrance.

To see the sold homes in Torrance CA visit our recent home sales page.

City # of sold homes November 2017 Median November 2016 Median Year over Year % Change%
Carson 49 $476,000 $450,000 5.9%
El Segundo 12 $1,243,000 $816,000 52.3%
Gardena 52 $533,000 $504,000 5.7%
Harbor City 10 $555,000 $523,000 6.1%
Hawthorne 30 $577,000 $575,000 .3%
Hermosa Beach 20 $1,550,000 $1,380,000 12.3%
Lawndale 18 $515,000 $393,000 31.2%
Lomita 11 $599,000 $473,000 26.8%
Long Beach 318 $510,000 $490,000 4%
Manhattan Beach 35 $2,300,000 $1,863,000 23.5%
Marina Del Rey 33 $925,000 $955,000 -3.1%
Palos Verdes Estates 27 $1,510,000 $1,550,000 -2.6%
Playa Del Rey 21 $710,000 $658,000 7.9%
Rancho Palos Verdes 31 $1,108,000 $1,088,000 1.8%
Redondo Beach 79 $955,000 $900,000 6.1%
San Pedro 55 $550,000 $515,000 6.8%
Torrance 117 $700,000 $656,000 6.6%
Westchester 35 $1,015,000 $943,000 7.6%

Torrance Home Sales and Median Home Prices for September

September was another busy month in South Bay Real estate with a strong number of home sales along with some impressve prices.  Torrance recorded 126 property sales with a median home price of just under $730,000.  The lowest sale of the month was a sharp 1 bedroom condo on Sepulveda for $269,900 with the high sale of the month being a beautiful 4600 foot single family home in the Seaside Ranchos/Christmas Lights area which sold at $2,400,000.  To see all of the homes sold in the South Bay in September visit our recent home sales page.

City Homes Sold September 2017 Median September 2016 Median Year over Year % Change%
Carson 55 $511,000 $462,000 10.5%
El Segundo 9 $1,130,000 $840,000 34.5%
Gardena 48 $475,000 $444,000 7.1%
Harbor City 22 $553,000 $465,000 19%
Hawthorne 46 $595,000 $558,000 6.6%
HermosaBeach 12 $2,150,000 $1,449,000 48.4%
Lawndale 15 $490,000 $479,000 2.3%
Lomita 12 $576,000 $593,000 -2.9%
Long Beach 326 $520,000 $478,000 8.8%
Manhattan Beach 38 $1,877,000 $2,200,000 -14.7%
Marina Del Rey 24 $933,000 $900,000 3.7%
Palos Verdes Estates 43 $1,600,000 $1,4023,000 14.1%
Playa Del Rey 17 $753,000 $538,000 39.9%
Rancho Palos Verdes 52 $1,250,000 $1,035,000 20.8%
Redondo Beach 86 $1,021,000 $1,035,000 20.8%
San Pedro 71 $558,000 $534,000 4.7%
Torrance 126 $728,000 $648,000 12.4%
Westchester 25 $1,140,000 $890,000 15.2%

Torrance Median Home Prices Up in July

What a month it was for home sales in Torrance and the South Bay.  Double digit year over year changes were the norm but there was really no sense to it with some cities seeing major increases over June of 2016 and some seeing just as major drops in home prices.

Real estate in Torrance CA was no different with another double digit jump for the median home prices compared with July of 2016. Torrance was actually a bit more moderate than other areas but still saw 113 homes close escrow in July with a median home price of just under $687,000  Click here to see the recent home sales in Torrance and the South Bay.

City Homes Sold July 2017 Median July 2016 Median Year over Year % Change%
Carson 60 $480,000 $445,000 8%
El Segundo 20 $1,055,000 $1,310,000 -19.5%
Gardena 65 $549,000 $454,000 21%
Harbor City 15 $439,000 $550,000 -20.2%
Hawthorne 35 $730,000 $562,000 30%
Hermosa Beach 19 $2,025,000 $1,410,000 43.6%
Lawndale 15 $515,000 $430,000 19.8%
Lomita 21 $598,000 $585,000 2.1%
Long Beach 331 $520,000 $471,500 10.3%
Manhattan Beach 48 $2,449,000 $2,200,000 11.3%
Marina Del Rey 36 $921,000 $974,000 -5.4%
Palos Verdes Estates 28 $1558,000 $1,800,000 -13.4%
Playa Del Rey 20 $613,000 $629,000 -2.5%
Rancho Palos Verdes 63 $1,345,000 $1,160,000 15.9%
Redondo Beach 95 $975,000 $920,000 6%
San Pedro 63 $542,000 $542,000 0%
Torrance 113 $687,000 $617,000 11.4%
Westchester 33 $1,185,000 $1,116,000 6.2%

See Torrance CA Home Prices for May 2017

Torrance saw a big increase in the monthly number of home sales in May 2017 with 140 homes closing escrow.  The median home price was an impressive $690,000 for the month.  See the Torrance CA real estate market trends and statistics here.  To see the homes that sold in Torrance CA for May visit our home sales page.

City Homes
Sold
May 2017 Median May 2016 Median Year over Year % Change%
Carson 41 $458,000 $453,000 1.2%
El Segundo 8 $880,000 $803,000 9.7%
Gardena 65 $523,000 $425,000 23.1%
Harbor City 14 $503,000 $439,000 14.5%
Hawthorne 46 $610,000 $485,000 25.8%
Hermosa Beach 26 $1,738,000 $1,285,000 35.3%
Lawndale 16 $485,000 $455,000 6.5%
Lomita 18 $653,000 $488,000 33.7%
Long Beach 356 $472,000 $485,000 -2.6%
Manhattan Beach 46 $2,175,000 $1,875,000 16%
Marina Del Rey 32 $933,000 $925,000 0.8%
Palos Verdes Estates 47 $1,650,000 $1,499,000 10.1%
Playa Del Rey 31 $720,000 $560,000 28.6%
Rancho Palos Verdes 51 $1,275,000 $1,060,000 20.3%
Redondo Beach 87 $1,054,000 $950,000 10.9%
San Pedro 63 $620,000 $489,000 26.8%
Torrance 140 $690,000 $593,000 16.4%
Westchester 44 $965,000 $1,130,000 -14.6%
Townhomes for sale - 2209 Nelson

28 Homes over $1,000,000 in Torrance

By Keith Kyle

It wasn’t long ago that a Torrance home in the million dollar range was a rarity….now it’s fairly commonplace. Currently there are 21 homes in the city of Torrance that are priced higher than this formerly elusive price. If you factor in homes in the homes for sale in the Hollywood Riviera, which has a Redondo Beach mailing address but is actually in the city of Torrance, there are actually 28 homes price over $1,000,000 with 5 homes priced over $2,000,000.