Real Estate Micro Market Update – Southwood Torrance

By Keith KyleSouthwood Torrance Homes

The neighborhood of Southwood in Torrance CA is a fantastic area with tree lined streets with primarily single family homes and a great community feel. Prices in this neighborhood, located just east of Redondo Beach, have seen steady increases since the beginning of 2013 and doesn’t show any signs of slowing down. Here’s a quick recap of the current real estate market conditions in this Torrance neighborhood.

  • In escrow – 8


  • Total homes sold in 2014 YTD – 20
  • Average sales price – $627,688
  • Average price per square foot – $474.73

21213 Anza Ave – Southwood Torrance Home for Sale

Currently the highest priced home in the great neighborhood of Southwood is located at 21213 Anza Ave.  The home is described as:

This is a beautiful 2003-2004 remodeled home with over 3500 square feet of living space. The lot consists of 6741 sq ft professionally landscaped with lush fruit trees, yard art and koi pond. The formal living room has 18 foot ceilings with a magnificent wood staircase that ascends to family sitting room. Off the sitting room there are three bedrooms each having its own private bath. The kitchen and great room are the center of this beautiful home with commercial appliances and granite flooring. On the main floor there is one bedroom with private bath.

The home is quite large for the area and has some interesting features but reaching a number of almost $1.2M on the busy street of Anza (although it’s on a service road off of the main street) seems quite unlikely.  Few homes in the area sell for anywhere near this rarified price and all are located in prime locations.

[idx-listing mlsnumber=”PV14078225″ showall=”true”]

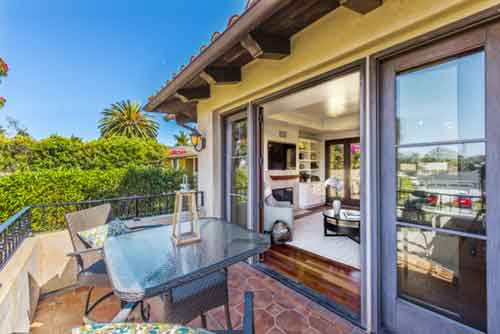
Hollywood Riviera homes for sale - 340 Via Colusa

West Torrance Real Estate Market Trends

When buying or selling homes in West Torrance, knowing and understanding the real estate market is critical to making the right decision. Real estate trends can help determine current values or even when the appropriate time to list and sell your West Torrance home. The information below is intended to help you get a better understanding of what is happening in the market.

The chart below shows the number of active listings (light green) sold homes (dark green) and pending home sales (red line) The greater the discrepancy between active homes and sold homes indicates a buyers market and when the numbers are closer a sellers market is indicated as inventory is down.

The chart below shows the average price per square foot. Square footage in the South Bay often doesn’t mean as much as in other markets as values can vary so dramatically due to things such as proximity to the beach, views, specific neighborhoods.

The chart below shows the average days on market per month as well as the % of list price that homes sold at. A high % indicates a sellers market as home sell at, or above list price.

The chart below shows the average price for listed home sales in relation to the average price for sold homes.

The chart below indicates the months of home inventory based on closed home sales. Buyer’s market: more than 6 months of inventory Seller’s market: less than 3 months of inventory Neutral market: 3 – 6 months of inventory