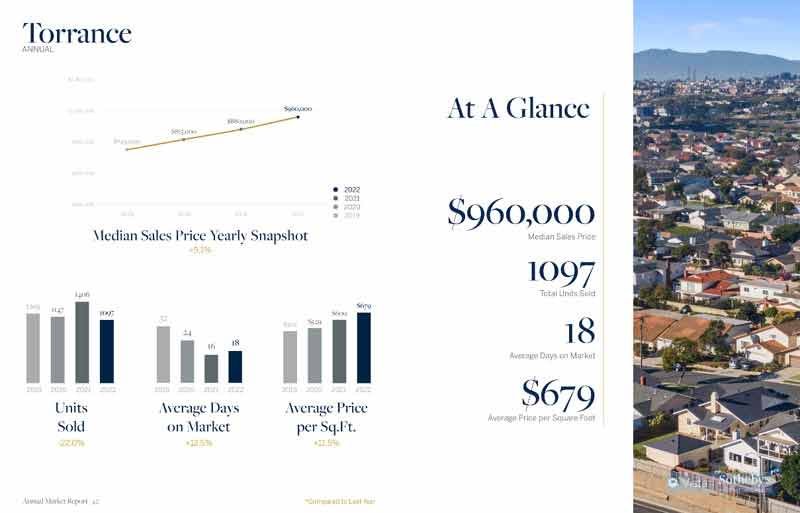
July Home Sales and House Prices in Torrance
July was a nice rebound month in terms of the number of homes that sold in Torrance with 106 homes closing escrow during the month. That’s a massive jump compared with may in which only 46 homes sold due to the uncertainty of the coronavirus situation. The median “list” price was $875,000 with the median “sold” price at $866,000 meaning that most homes sold very close to full asking price. The median price per foot was $535.77.
View all of the current Torrance homes for sale
July Home Sales and Property Prices in Torrance
| MLS | Type | Address | Sold Price | $ Per Foot | Bed/Bath | Sq Feet | Year | Date | |
| PW20101695 | SFR/D | 21127 | Normandie AVE | $580,000 | $767.20 | 2/1,0,0,0 | 756/A | 1952/ASR | 7/2/2020 |
| PV20083388 | SFR/A | 20603 | Budlong AVE | $610,000 | $376.54 | 5/3,0,0,0 | 1620/A | 1951/ASR | 7/17/2020 |
| SB20079964 | SFR/D | 1445 W | 214th ST | $680,000 | $508.22 | 4/2,0,0,0 | 1338/A | 1944/ASR | 7/16/2020 |
| OC20106055 | SFR/D | 1404 W | 222nd ST | $700,000 | $509.09 | 4/2,0,0,0 | 1375/A | 1954/ASR | 7/15/2020 |
| 20573710 | CONDO | 20415 S | VERMONT AVE #3 | $315,000 | $481.65 | 1/1,0,0,0 | 654/ | 1980/ASR | 7/29/2020 |
| 20577738 | CONDO | 1109 | SEPULVEDA #E101 | $324,000 | $524.27 | 1/1,0,0,0 | 618/ | 1973/ASR | 7/9/2020 |
| PW20093135 | CONDO/A | 806 | Coriander DR #C | $370,000 | $446.32 | 2/2,0,0,0 | 829/A | 1973/PUB | 7/3/2020 |
| BB20104213 | CONDO/A | 20505 S | Vermont AVE #2 | $382,500 | $398.85 | 2/2,0,0,0 | 959/A | 1980/ASR | 7/9/2020 |
| SB20110197 | CONDO/A | 23308 | Sesame ST #E | $389,000 | $469.24 | 2/2,0,0,0 | 829/A | 1973/ASR | 7/13/2020 |
| SB20102346 | CONDO/A | 20565 S | Vermont AVE #1 | $403,000 | $416.32 | 2/2,0,0,0 | 968/A | 1982/ASR | 7/17/2020 |
| SB20128221 | CONDO/A | 21830 S | Vermont AVE #106 | $459,000 | $428.57 | 3/2,0,0,0 | 1071/A | 1994/ASR | 7/30/2020 |
| SB20104952 | TWNHS/A | 1127 W | 228th ST W #19 | $510,000 | $342.28 | 3/2,0,1,0 | 1490/A | 1988/ASR | 7/30/2020 |
| SB20094017 | SFR/D | 20809 | Conradi AVE | $535,000 | $457.66 | 3/2,0,0,0 | 1169/A | 1961/ASR | 7/17/2020 |
| PW20093072 | SFR/D | 20711 | Berendo AVE | $575,000 | $385.91 | 3/1,0,0,0 | 1490/A | 1925/ASR | 7/2/2020 |
| SB20081150 | SFR/D | 1039 W | 210th ST | $630,000 | $519.80 | 3/2,0,0,0 | 1212/A | 1953/ASR | 7/15/2020 |
| 20576764 | SFR | 1134 W | 228TH ST | $630,000 | $571.17 | 3/2,0,0,0 | 1103/O | 1949 | 7/1/2020 |
| SB20072745 | SFR/D | 1016 | Oakwater ST | $710,000 | $413.27 | 3/2,0,0,0 | 1718/A | 1966/ASR | 7/3/2020 |
| SB20099897 | TWNHS/D | 1073 W | 228th ST | $765,000 | $371.72 | 5/3,0,0,0 | 2058/A | 2016/PUB | 7/2/2020 |
| SB20111002 | SFR/D | 23422 | Broadwell AVE | $767,000 | $325.83 | 4/3,0,0,0 | 2354/A | 1969/ASR | 7/16/2020 |
| DW20092832 | SFR/D | 2527 | Loftyview DR | $845,000 | $563.71 | 3/2,0,0,0 | 1499/A | 1955/ASR | 7/2/2020 |
| SB20061947 | SFR/D | 2839 | Danaha ST | $867,000 | $662.84 | 3/2,0,0,0 | 1308/A | 1952/ASR | 7/24/2020 |
| SB20125093 | SFR/D | 25718 | Crest | $870,000 | $744.86 | 3/1,0,0,1 | 1168/P | 1954/PUB | 7/27/2020 |
| SB20092259 | SFR/D | 2415 | Grand Summit RD | $910,000 | $697.32 | 2/2,0,0,0 | 1305/A | 1955/ASR | 7/17/2020 |
| PV20069786 | SFR/D | 25824 | Skylark DR | $940,000 | $774.30 | 3/1,1,0,0 | 1214/A | 1954/PUB | 7/2/2020 |
| SB20091900 | SFR/D | 24225 | Park ST | $970,000 | $634.82 | 3/1,1,0,0 | 1528/A | 1954/ASR | 7/2/2020 |
| SB20118599 | SFR/D | 3334 | Dalemead ST | $1,000,000 | $677.51 | 3/1,1,0,0 | 1476/A | 1952/ASR | 7/28/2020 |
| SB20122907 | SFR/D | 25230 | Weston RD | $1,030,000 | $572.86 | 4/2,0,0,0 | 1798/A | 1953/ASR | 7/31/2020 |
| PW20027116 | SFR/D | 2907 | Oakwood LN | $1,300,000 | $486.53 | 5/3,0,0,0 | 2672/A | 1976/ASR | 7/28/2020 |
| SB20099581 | SFR/D | 3232 | Carolwood LN | $1,430,100 | $535.22 | 5/4,0,0,0 | 2672/A | 1976/ASR | 7/9/2020 |
| SB20036227 | CONDO/A | 3550 | Torrance BLVD #515 | $285,000 | $581.63 | 0/0,1,0,0 | 490/A | 2006/ASR | 7/20/2020 |
| PV20116455 | CONDO/A | 2940 W | Carson ST #116 | $410,000 | $495.17 | 2/1,0,0,0 | 828/A | 1962/ASR | 7/22/2020 |
| SB20098354 | CONDO/A | 2605 | Sepulveda BLVD #201 | $474,000 | $477.34 | 1/2,0,0,0 | 993/A | 2003/ASR | 7/7/2020 |
| PW20097802 | CONDO/A | 2800 | Plaza Del Amo #502 | $645,000 | $506.68 | 2/2,0,1,0 | 1273/A | 1987/ASR | 7/21/2020 |
| SB20126503 | TWNHS/A | 2621 | Plaza Del Amo #528 | $760,000 | $531.84 | 2/2,0,1,0 | 1429/A | 1987/ASR | 7/30/2020 |
| SW20029192 | SFR/D | 3017 | W. CARSON ST. | $777,000 | $602.33 | 3/2,0,0,0 | 1290/A | 1955/ASR | 7/29/2020 |
| SB20111566 | TWNHS/A | 2615 | Plaza Del Amo #614 | $782,000 | $512.45 | 2/2,0,1,0 | 1526/A | 1987/ASR | 7/22/2020 |
| SB20122592 | SFR/D | 20550 | Eastwood AVE | $956,000 | $612.43 | 3/1,1,0,0 | 1561/A | 1958/ASR | 7/31/2020 |
| SB20150695 | SFR/D | 2545 | Woodbury DR | $1,100,000 | $445.34 | 4/3,0,0,0 | 2470/A | 1991/ASR | 7/28/2020 |
| PV20098418 | SFR/D | 3704 | Sara DR | $1,310,000 | $575.07 | 4/3,0,0,0 | 2278/A | 1969/ASR | 7/8/2020 |
| SB20055312 | CONDO/A | 22615 | Nadine CIR #B | $405,000 | $362.58 | 2/2,0,0,0 | 1117/A | 1963/ASR | 7/8/2020 |
| SB20069682 | CONDO/A | 22927 | Nadine CIR #B | $459,000 | $410.92 | 1/2,0,0,0 | 1117/A | 1963/ASR | 7/2/2020 |
| OC20063137 | CONDO/A | 22741 | Nadine CIR #A | $489,000 | $514.74 | 2/2,0,0,0 | 950/A | 1963/ASR | 7/6/2020 |
| SB20122307 | CONDO/A | 22705 | Nadine CIR #A | $545,000 | $487.91 | 2/2,0,0,0 | 1117/A | 1963/ASR | 7/13/2020 |
| 20573106 | SFR | 3414 W | 226TH ST | $833,000 | $687.86 | 3/2,0,0,0 | 1211/ | 1954/EST | 7/30/2020 |
| WS20096216 | SFR/D | 2242 W | 229th ST | $899,900 | $583.97 | 4/2,0,0,0 | 1541/A | 1957/PUB | 7/10/2020 |
| SB20109709 | SFR/D | 2566 W | 234th ST | $951,000 | $507.47 | 3/2,0,0,0 | 1874/A | 1964/ASR | 7/24/2020 |
| PV20056829 | SFR/D | 4012 | Mesa ST | $850,000 | $521.47 | 3/2,0,1,0 | 1630/A | 1972/ASR | 7/23/2020 |
| SB20061127 | SFR/D | 4520 | Highgrove AVE | $1,150,000 | $709.88 | 3/3,0,0,0 | 1620/T | 1953/ASR | 7/17/2020 |
| PV20098818 | SFR/D | 5419 | Riviera Way | $1,160,000 | $741.69 | 3/1,1,0,0 | 1564/A | 1954/ASR | 7/6/2020 |
| SB20081287 | SFR/D | 5014 | Paseo De Las Tortugas | $1,230,000 | $763.03 | 3/2,0,0,0 | 1612/A | 1956/ASR | 7/8/2020 |
| PV20097708 | SFR/D | 5210 | Zakon RD | $780,000 | $816.75 | 2/1,0,0,0 | 955/A | 1949/ASR | 7/30/2020 |
| SB20105730 | SFR/D | 4141 W | 229th ST | $900,000 | $693.37 | 3/2,0,0,0 | 1298/A | 1955/ASR | 7/10/2020 |
| PW20090413 | SFR/D | 4721 | Bindewald RD | $910,000 | $764.71 | 3/2,0,0,0 | 1190/A | 1955/ASR | 7/20/2020 |
| SB20098995 | SFR/D | 5257 | Bindewald RD | $920,000 | $702.29 | 2/2,0,0,0 | 1310/A | 1949/ASR | 7/16/2020 |
| SB20065488 | SFR/D | 4829 | Macafee RD | $950,000 | $772.36 | 3/1,0,1,0 | 1230/A | 1956/ASR | 7/7/2020 |
| SB20095453 | SFR/D | 23105 | Kent AVE | $957,000 | $617.02 | 3/1,1,0,0 | 1551/A | 1961/ASR | 7/30/2020 |
| SB20087031 | SFR/D | 22508 | Linda DR | $1,125,000 | $778.01 | 3/3,0,0,0 | 1446/A | 1952/ASR | 7/31/2020 |
| SB20148305 | SFR/D | 5136 | Carol DR | $1,175,000 | $575.98 | 3/2,0,0,0 | 2040/S | 1951/ASR | 7/24/2020 |
| SB20121564 | SFR/D | 23211 | Evalyn AVE | $1,210,000 | $714.71 | 3/2,0,0,0 | 1693/A | 1960/ASR | 7/15/2020 |
| IN20015697 | SFR/D | 5351 | Bindewald RD | $1,320,000 | $482.10 | 4/2,0,1,0 | 2738/A | 1994/ASR | 7/14/2020 |
| PW20092223 | SFR/A | 22517 | Biak CT | $1,720,000 | $424.80 | 4/4,0,0,0 | 4049/A | 2007/ASR | 7/31/2020 |
| PV20060470 | SFR/D | 5106 | Sharynne LN | $1,975,000 | $741.37 | 4/3,0,0,0 | 2664/A | 1949/ASR | 7/24/2020 |
| SB20116665 | SFR/D | 5203 | Lillian ST | $890,000 | $765.92 | 3/2,0,0,0 | 1162/A | 1956/ASR | 7/29/2020 |
| SB20098070 | SFR/A | 21422 | Marjorie AVE | $962,500 | $828.31 | 3/2,0,0,0 | 1162/A | 1956/ASR | 7/16/2020 |
| SB20097219 | SFR/D | 21913 | Linda DR | $972,500 | $568.05 | 4/2,0,0,0 | 1712/A | 1955/ASR | 7/10/2020 |
| SB20113711 | SFR/D | 21914 | Linda DR | $990,000 | $513.49 | 4/2,0,0,0 | 1928/A | 1955/ASR | 7/24/2020 |
| SB20101483 | SFR/D | 5208 | Cathann ST | $1,000,000 | $698.32 | 3/1,1,0,0 | 1432/A | 1955/ASR | 7/2/2020 |
| SB20072778 | SFR/D | 21401 | Ocean AVE | $1,025,000 | $670.37 | 4/1,1,0,0 | 1529/AP | 1956/ASR | 7/29/2020 |
| SB20097815 | TWNHS/A | 5220 W | 190th ST | $785,000 | $428.73 | 3/2,0,1,0 | 1831/A | 1976/ASR | 7/1/2020 |
| SB20079981 | SFR/D | 4567 | Narrot ST | $884,000 | $583.11 | 3/2,0,0,0 | 1516/A | 1954/ASR | 7/31/2020 |
| SB20090739 | SFR/D | 5202 | Arvada ST | $896,000 | $563.88 | 3/2,0,0,0 | 1589/A | 1954/ASR | 7/6/2020 |
| SB20086649 | SFR/D | 19125 | Anza AVE | $900,000 | $505.05 | 3/2,0,0,0 | 1782/A | 1954/ASR | 7/1/2020 |
| SB20083596 | SFR/D | 4803 | Cadison ST | $929,000 | $522.79 | 4/0,2,0,0 | 1777/A | 1954/ASR | 7/9/2020 |
| SB20109118 | SFR/D | 19320 | Entradero AVE | $980,000 | $459.45 | 4/1,2,0,0 | 2133/A | 1955/ASR | 7/24/2020 |
| SB20055502 | SFR/D | 4927 | Halison ST | $1,035,000 | $488.21 | 4/2,0,0,0 | 2120/O | 1955/ASR | 7/24/2020 |
| SB20102965 | SFR/D | 5043 | Halison ST | $1,045,000 | $660.97 | 3/2,0,0,0 | 1581/A | 1955/ASR | 7/14/2020 |
| SB20074575 | SFR/D | 19420 | Entradero AVE | $1,045,000 | $571.98 | 4/1,1,0,0 | 1827/A | 1955/ASR | 7/16/2020 |
| PV20112847 | SFR/D | 4622 | Deelane ST | $1,288,000 | $531.79 | 4/1,1,1,0 | 2422/A | 1974/ASR | 7/31/2020 |
| SB20109778 | SFR/A | 18801 | Felbar AVE | $745,000 | $573.08 | 3/1,1,0,0 | 1300/A | 1955/ASR | 7/10/2020 |
| SB20095775 | SFR/D | 3428 W | 186th ST | $780,000 | $542.80 | 3/2,0,0,0 | 1437/A | 1950/ASR | 7/2/2020 |
| SB20103136 | SFR/D | 18708 | Doty AVE | $790,000 | $628.98 | 3/1,0,1,0 | 1256/A | 1954/ASR | 7/10/2020 |
| TR20097771 | SFR/D | 3715 W | 187th ST | $840,000 | $685.71 | 3/1,0,1,0 | 1225/A | 1954/ASR | 7/2/2020 |
| SB20114158 | SFR/D | 18038 | Faysmith AVE | $879,000 | $497.17 | 4/3,0,0,0 | 1768/A | 1953/APP | 7/27/2020 |
| PW20112014 | TWNHS/A | 18320 | Kingsdale AVE | $899,000 | $454.04 | 4/2,0,1,0 | 1980/A | 1984/ASR | 7/28/2020 |
| SB20117318 | SFR/D | 4239 W | 178th ST | $908,000 | $578.34 | 3/2,0,0,0 | 1570/A | 1949/ASR | 7/24/2020 |
| PW20110463 | SFR/D | 2416 W | 164th ST | $750,000 | $531.16 | 4/2,0,0,0 | 1412/A | 1951/ASR | 7/22/2020 |
| 219044426DA | SFR/D | 2620 W | 176th ST | $750,000 | $492.77 | 3/1,1,0,0 | 1522/A | 1950/ASR | 7/21/2020 |
| SB20023218 | SFR/D | 17316 | Wilton PL | $766,000 | $662.06 | 3/1,0,1,0 | 1157/A | 1954/ASR | 7/2/2020 |
| SB20090751 | SFR/D | 2038 W | 177th ST | $815,000 | $664.22 | 4/2,0,0,0 | 1227/A | 1953/ASR | 7/27/2020 |
| SB20118224 | SFR/D | 2517 W | 180th PL | $865,000 | $512.74 | 4/1,1,0,0 | 1687/A | 1956/ASR | 7/24/2020 |
| SB20121452 | TWNHS/A | 17502 | Van Ness AVE #1 | $905,000 | $509.57 | 3/2,0,2,0 | 1776/B | 2018/ASR | 7/15/2020 |
| SB20106356 | CONDO/A | 2742 | Cabrillo AVE #205 | $322,500 | $481.34 | 1/1,0,0,0 | 670/A | 2006/ASR | 7/6/2020 |
| PW20106824 | TWNHS/A | 2513 | Apple AVE #D | $654,000 | $608.94 | 2/2,0,1,0 | 1074/A | 2002/ASR | 7/10/2020 |
| SB20104816 | SFR/D | 1515 | Beech AVE | $711,000 | $858.70 | 2/1,0,0,0 | 828/A | 1927/ASR | 7/20/2020 |
| SB19018073 | SFR/D | 1609 | Acacia AVE | $714,900 | $530.73 | 3/1,1,0,0 | 1347/A | 1928/APP | 7/8/2020 |
| SB20089885 | SFR/D | 2011 | Gramercy AVE | $720,000 | $700.39 | 3/1,0,0,0 | 1028/A | 1912/ASR | 7/7/2020 |
| SB20083231 | SFR/D | 1716 | Watson AVE | $735,000 | $537.28 | 3/1,0,0,0 | 1368/A | 1941/ASR | 7/14/2020 |
| SB20122134 | SFR/D | 2019 | Gramercy AVE | $833,000 | $720.59 | 3/2,0,0,0 | 1156/AP | 1918/ASR | 7/28/2020 |
| SB20105711 | SFR/D | 1605 | Beech AVE | $929,000 | $581.35 | 3/1,1,0,0 | 1598/A | 1928/ASR | 7/10/2020 |
| SB20085944 | SFR/D | 23837 | Walnut ST | $863,000 | $470.04 | 4/1,1,0,0 | 1836/AP | 1963/ASR | 7/9/2020 |
| CV20069282 | SFR/D | 2161 W | 236th PL | $875,000 | $399.18 | 4/2,0,0,0 | 2192/A | 1972/SEE | 7/15/2020 |
| SB20099161 | SFR/D | 2366 W | 229th ST | $938,800 | $524.47 | 3/2,0,0,0 | 1790/A | 1930/ASR | 7/2/2020 |
| SB20125770 | SFR/D | 2314 W | 236th PL | $940,000 | $524.26 | 3/2,0,0,0 | 1793/A | 1961/ASR | 7/30/2020 |
| OC20095342 | SFR/D | 2308 W | 238th ST | $965,000 | $588.41 | 4/2,0,0,0 | 1640/A | 1953/ASR | 7/2/2020 |
| PV20106440 | SFR/D | 2059 | Reynosa Drive | $983,888 | $360.00 | 4/2,1,0,0 | 2733/A | 1947/ASR | 7/14/2020 |
| SB20061115 | SFR/D | 23122 | Meyler AVE | $657,000 | $536.33 | 3/1,1,0,0 | 1225/SEE | 1956/SEE | 7/10/2020 |
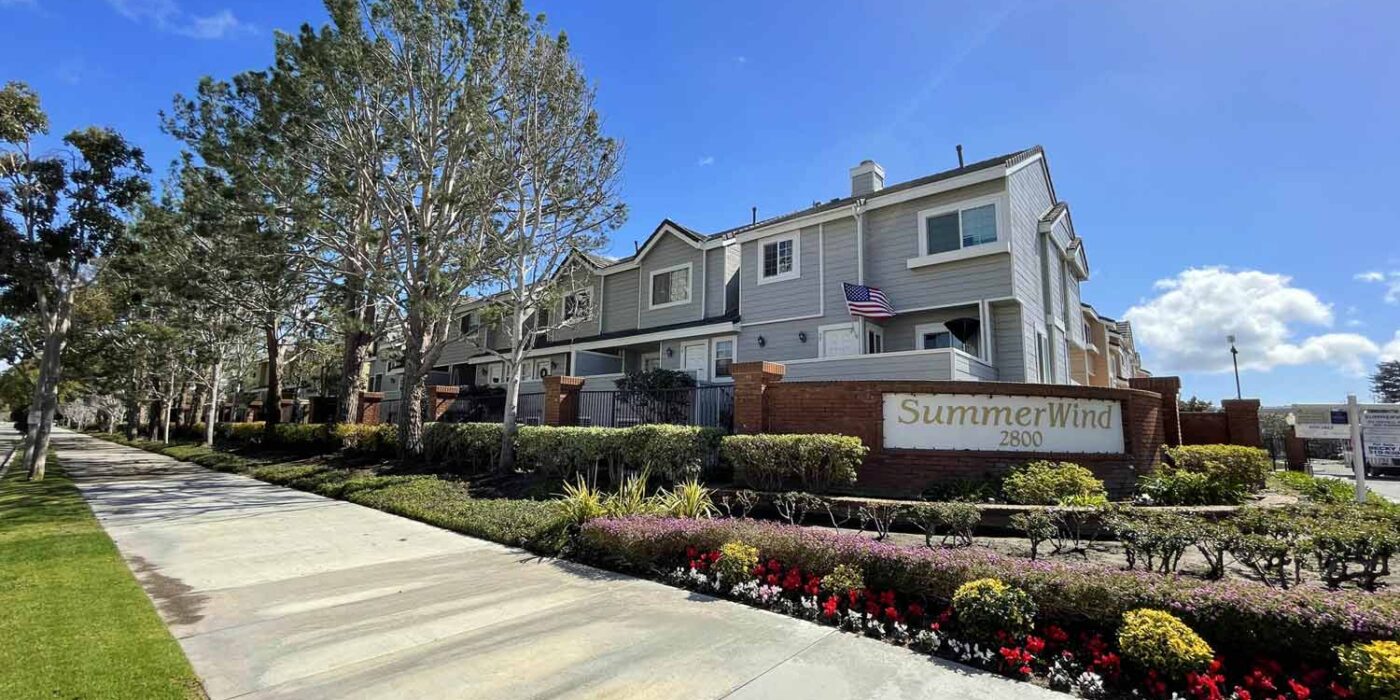
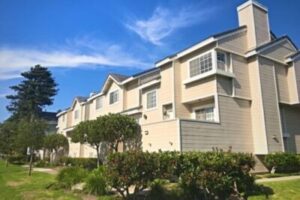
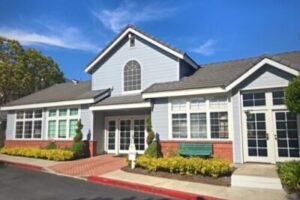
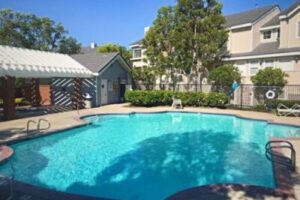
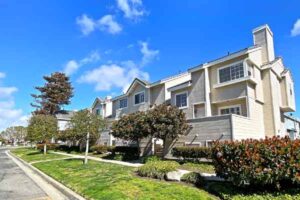
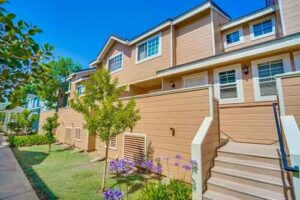
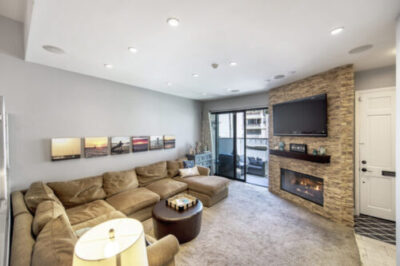
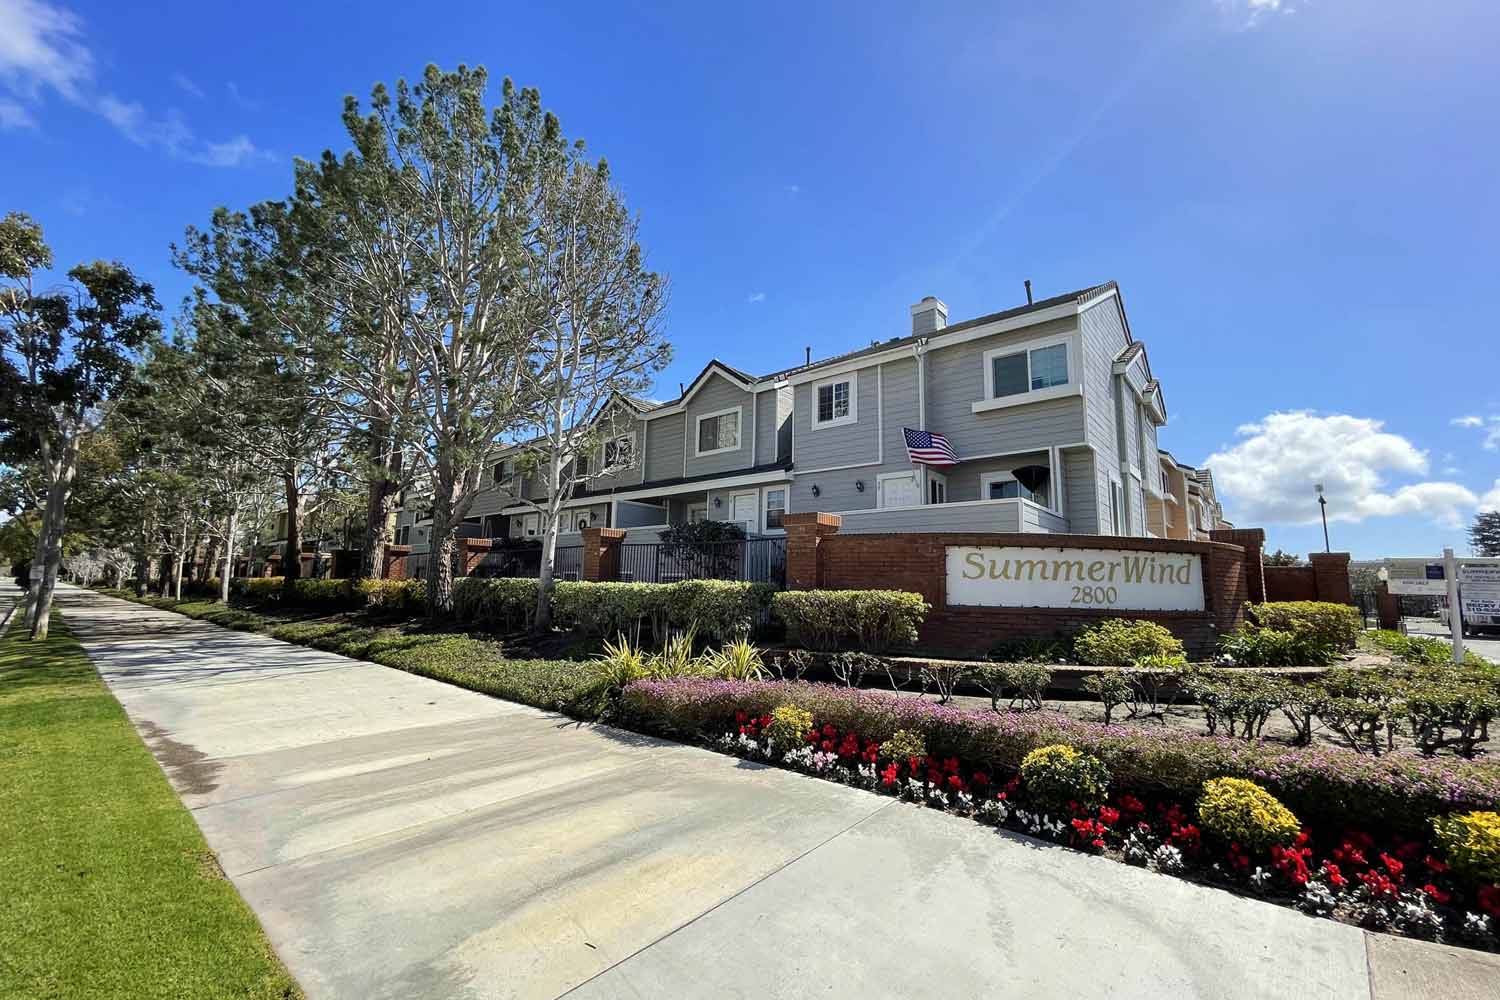 SummerWind is the largest of the gated communities in the Plaza Del Amo area of Torrance. This beautiful complex offers 508 individually owned townhome style attached units.