Torrance Median Home Prices Up in July

What a month it was for home sales in Torrance and the South Bay.  Double digit year over year changes were the norm but there was really no sense to it with some cities seeing major increases over June of 2016 and some seeing just as major drops in home prices.

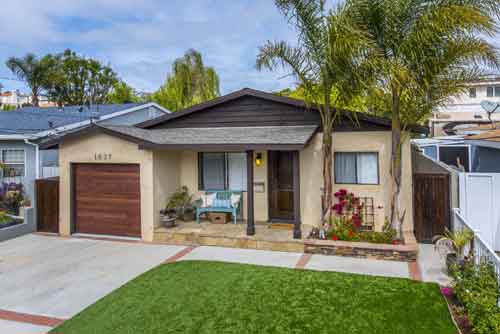
Real estate in Torrance CA was no different with another double digit jump for the median home prices compared with July of 2016. Torrance was actually a bit more moderate than other areas but still saw 113 homes close escrow in July with a median home price of just under $687,000  Click here to see the recent home sales in Torrance and the South Bay.

City Homes Sold July 2017 Median July 2016 Median Year over Year % Change%
Carson 60 $480,000 $445,000 8%
El Segundo 20 $1,055,000 $1,310,000 -19.5%
Gardena 65 $549,000 $454,000 21%
Harbor City 15 $439,000 $550,000 -20.2%
Hawthorne 35 $730,000 $562,000 30%
Hermosa Beach 19 $2,025,000 $1,410,000 43.6%
Lawndale 15 $515,000 $430,000 19.8%
Lomita 21 $598,000 $585,000 2.1%
Long Beach 331 $520,000 $471,500 10.3%
Manhattan Beach 48 $2,449,000 $2,200,000 11.3%
Marina Del Rey 36 $921,000 $974,000 -5.4%
Palos Verdes Estates 28 $1558,000 $1,800,000 -13.4%
Playa Del Rey 20 $613,000 $629,000 -2.5%
Rancho Palos Verdes 63 $1,345,000 $1,160,000 15.9%
Redondo Beach 95 $975,000 $920,000 6%
San Pedro 63 $542,000 $542,000 0%
Torrance 113 $687,000 $617,000 11.4%
Westchester 33 $1,185,000 $1,116,000 6.2%

Torrance Home Sales and Median Home Prices for June 2017

June was a big month for home sales in Torrance CA with a fairly huge number of homes selling.  The summer months are always an active market and this year was no different with 184 homes selling..  Thats well above the normal number of Torrance homes selling in a month.  Median home prices were up just a bit over June of the previous year with the median home in Torrance selling at $673,000.  Click here to track all of the important real estate trends for Torrance CA.

City Homes Sold June 2017 Median June 2016 Median Year over Year % Change%
Carson 61 $445,000 $450,000 -1.1%
El Segundo 15 $800,000 $1,135,000 -29%
Gardena 70 $461,000 $430,000 7.2%
Harbor City 19 $465,000 $547,000 -15%
Hawthorne 45 $592,000 $624,000 -5.1%
Hermosa Beach 26 $1,718,000 $1,274,500 34.8
Lawndale 12 $535,000 $519,000 3.1%
Lomita 18 $565,000 $555,000 1.8%
Long Beach 419 $523,000 $470,000 11.2%
Manhattan Beach 57 $2,467,000 $1,924,000 28.2%
Marina Del Rey 34 $968,000 $900,000 7.6%
Palos Verdes Estates 46 $1,679,000 $1,533,000 9.5%
Playa Del Rey 34 $683,000 $603,000 13.3%
Rancho Palos Verdes 75 $1,240,000 $1,200,000 3.3%
Redondo Beach 117 $969,000 $945,000 2.5%
San Pedro 82 $510,000 $500,000 1.9%
Torrance 184 $673,000 $635,000 5.9%
Westchester 42 $1,090,000 $1,050,000 3.8%

See the Torrance Sold Homes for September 2016

September was a strong month for home sales in Torrance CA and the South Bay.  Click any link below to see a list of the homes that sold that month or visit our recent South Bay home sales page to see any month and any city in the area.  We hope that the information is helpful and please do not hesitate to contact us for any of your real estate needs.

 September 2016 Home Sales

El Segundo
Gardena
Hawthorne
Hermosa Beach
Hollyglen & Del Aire
Hollywood Riviera
Lawndale
Manhattan Beach
Palos Verdes Estates
Rancho Palos Verdes
Redondo Beach
Rolling Hills Estates
San Pedro
Torrance

Golden Hills Homes Redondo Beach - Armour Lane

Torrance Home Sales in June of 2016 Post Huge Numbers

By Keith KyleGolden Hills Homes Redondo Beach - Armour Lane

The numbers are in and June 2016 was a big month in terms of both the number of homes sold and the prices.  Home prices were up year over year in every South Bay city other than Manhattan Beach and Torrance CA posted some very big numbers.  141 homes and properties sold in June at a very respectable median price of $640,000 which is higher than normal.  To see the homes sold in Redondo Beach for June 2016 view our recent sales information.

City Homes
Sold
June
2016 Median
June
2015 Median
Year
over Year % Change%
Carson 63 $450,000 $425,000 5.8%
El Segundo 17 $1,121,000 $888,000 26.2%
Gardena 47 $430,000 $399,000 7.8%
Harbor City 18 $547,000 $360,000 51.9%
Hawthorne 37 $624,000 $539,000 15.7%
Hermosa Beach 24 $1,248,000 $1,230,000 3.6%
Lawndale 13 $519,000 $450,000 15.2%
Lomita 16 $555,000 $530,000 4.7%
Long Beach 408 $470,000 $450,000 4.4%
Manhattan Beach 40 $1,962,000 $2,400,000 -18.25%
Marina Del Rey 32 $900,000 $810,000 11.1%
Palos Verdes Estates 39 $1,533,000 $1,500,000 2.2%
Playa Del Rey 22 $603,000 $610,000 -1.2%
Rancho Palos Verdes 75 $1,200,000 $1,110,000 8.2%
Redondo Beach 99 $950,000 $870,000 9.2%
San Pedro 79 $500,000 $472,000 6%
Torrance 141 $640,000 $597,000 7.2%
Westchester 44 $1,050,000 $923,000 13.8%

Torrance Home Sales Up in May of 2016

Torrance, CA saw a slight gain in year over year home prices in May with 138 homes sold this month at a median price of around $593,000 which was up from $579,000 the prior May.  138 homes is a very strong number for Torrance and shows that the market activity is continuing to pick up with more homes slowly coming on the market.  Click here to see the homes sold in Torrance for May of 2016.

City Homes
Sold
May
2016 Median
May
2015 Median
Year
over Year % Change%
Carson 57 $453,000 $410,000 10.4%
El Segundo 12 $802,500 $803,500 -.1%
Gardena 47 $425,000 $405,000 4.9%
Harbor City 26 $439,000 $415,000 5.8%
Hawthorne 39 $485,000 $525,000 -7.7%
Hermosa Beach 21 $1,285,000 $1,450,000 -11.4%
Lawndale 14 $455,000 $431,000 5.6%
Lomita 15 $488,000 $509,000 -4.1%
Long Beach 349 $485,000 $433,000 11.9%
Manhattan Beach 48 $1,875,000 $2,239,000 -16.2%
Marina Del Rey 31 $925,000 $918,000 .8%
Palos Verdes Estates 55 $1,499,000 $1,515,000 -1.1%
Playa Del Rey 24 $560,000 $615,000 -8.9%
Rancho Palos Verdes 58 $1,060,000 $1,100,000 -3.6%
Redondo Beach 96 $950,000 $845,000 12.5%
San Pedro 66 $489,000 $449,000 8.8%
Torrance 138 $593,000 $579,000 2.4%
Westchester 30 $1,130,000 $900,000 25.6%