Torrance real estate 2022

Torrance Real Estate Market Trends

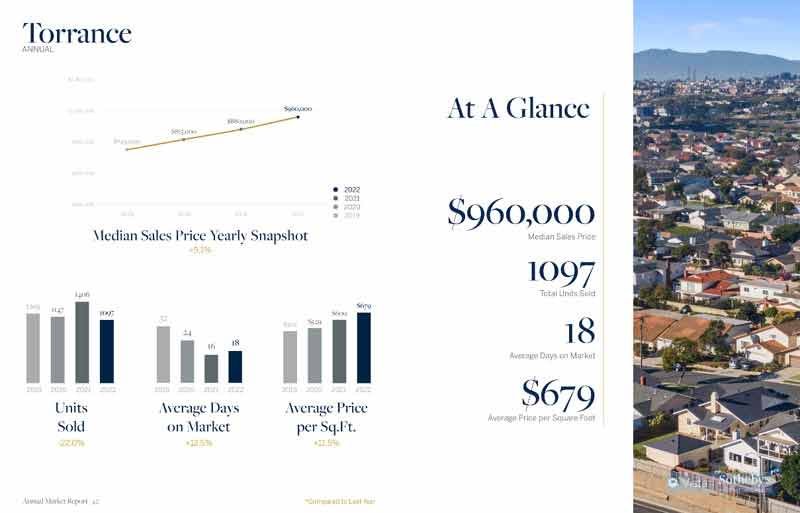
The market in Torrance has continued to be very favorable to sellers with the demand so high and the inventory still considerably low.  The past 3 months have seen a slight increase in inventory which may be temporary or may be showing signs that the very beginning of a more balanced market is on it’s way.  Keep in mind that Torrance is a big city and prices, demand, values, and trends can vary considerably throughout the city.  The chart below shows the number of active Torrance homes for sale (light green bar) the number of homes that went into escrow (red line) and the number of homes sold in that month (teal bar).  When the trend shows a monthly increase in homes for sale the market is heading towards a more balanced situation.  At the moment it is very much a sellers market.

For buyers, and especially first time buyers, the chart below is a helpful tool to determine what price to offer.  This is for all of Torrance and different neighborhoods vary, and certainly individual homes can be a different situation depending on what price is was listed at.  For the month of September selling prices were within 3% of the list prices.

What does this mean?

For buyers this generally means that “going in low” is probably not the right strategy.  Consult with your realtor as they should have a handle on what the value of the home should be and whether the asking price was set too high, or too low in the hopes of generating multiple offers and a potential bidding war.

Old Torrance Real Estate Trends

By Keith KyleTorrance Home Updates

As knowledge is critical in real estate, we hope that the information provided below will make the real estate market in Old Torrance easier to understand and the trends can make for educated decisions.  Whether you are a buyer, or a seller, knowing what the market is doing and where it appears to be heading can make all of the difference in the world.   If we can be of assistance in any way please don’t hesitate to contact us.  You can view these trends for all Torrance CA neighborhoods.

The chart below shows the recent history of the number of active listings, pending home sales and closed escrows.  The higher ratio of active to sold/pending listings shows a buyers market while lower inventory shows a sellers market.

The chart below shows the average price per square foot in Old Torrance.  This includes all types of homes including condos, townhomes and single family homes

The chart below shows the percentage of sold price / list price at which an equal number of properties are sold above, equal or below the list price and it indicates how long it has taken to sell those properties.

The chart below shows the difference between the average price for sale in Old Torrance and average price of the sold homes.  It helps determine whether the market is a buyer or seller market. If the average listing price and average sold price are the closest, the area has the healthiest market.

The chart below shows the months of inventory for a particular month.  As a rule of thumb, an inventory level of less than three indicates a strong seller market while an inventory level greater than six indicates a buyer’s market.

Torrance homes for sale

Walteria and Victoria Knolls Torrance Real Estate Market Trends

When buying or selling homes in the Walteria and Victoria Knolls neighborhoods of Torrance, knowing and understanding the real estate market is critical to making the right decision. Real estate trends can help determine current values or even when the appropriate time to list and sell your  home. The information below is intended to help you get a better understanding of what is happening in the market. Sitting just east of the Hollywood Riviera and South Torrance, Walteria is a very community oriented area with most homes within walking distance to local schools, homes with appropriate sized lots and tree lined streets.  To see the actual prices and homes sold in Torrance last month visit our recent home sales page.

The chart below shows the number of active listings (light green) sold homes (dark green) and pending home sales (red line) The greater the discrepancy between active homes and sold homes indicates a buyers market and when the numbers are closer a sellers market is indicated as inventory is down.

The chart below shows the average price per square foot. Square footage in the South Bay often doesn’t mean as much as in other markets as values can vary so dramatically due to things such as proximity to the beach, views, specific neighborhoods.

The chart below shows the average days on market per month as well as the % of list price that homes sold at. A high % indicates a sellers market as home sell at, or above list price.

The chart below shows the average price for listed home sales in relation to the average price for sold homes.

The chart below indicates the months of home inventory based on closed home sales. Buyer’s market: more than 6 months of inventory Seller’s market: less than 3 months of inventory Neutral market: 3 – 6 months of inventory

CONTACT US

for all of your Torrance real estate services

your torrance realtor

Torrance realtor Keith Kyle
Keith Kyle
Realtor

DRE#01712785

Vista Sotheby's logo

REALESTATETORRANCE – All rights reserved – Designed and Developed by Keith Kyle Homes