Chatelaine in Plaza Del Amo

The Gated Townhome Communities of Plaza Del Amo Torrance

By Keith KyleSouth Bayport in Plaza Del Amo Torrance

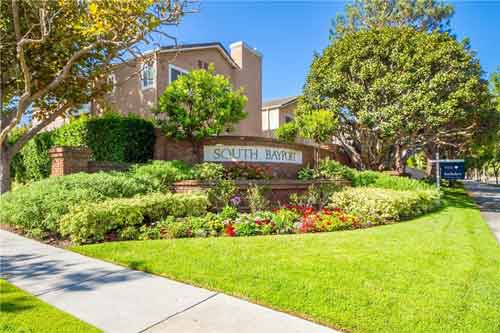
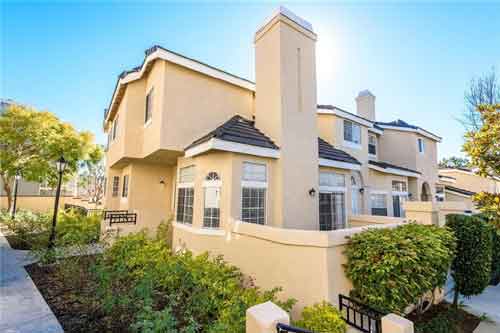
Central Torrance offers a series of communities fairly unique in the South Bay known as the Plaza Del Amo area offering an abundance of townhome style homes in several gated communities.  Although each community has a different name and HOA, they are generally located on Plaza Del Amo in the 90501 zip code.  Ideally located near major shopping centers, recreational facilities, parks, and restaurants, the communities of Plaza Del Amo are fantastic housing options for buyers looking for good areas, good schools, gated communities with an abundance of activities.

Click here to view the current homes in Plaza Del Amo

Prices currently range from the high $300,000s for one of the few one bedroom condo style units to around $800,000 for a much larger 4 bedroom detached townhome (often marketed as single family homes).  Most complexes offer pools and various other community buildings.

Want and even easier way to search for homes?  Tell us just a bit about what you’re looking for in a home and we’ll customize a search just for you and send you email alerts whenever a new home hits the market.  Never miss a new listing in Torrance and Plaza Del Amo again!

One of the aspects that make the areas and communities desirable is the highly rated Torrance school system and the area is generally served by Hickory Elementary, Madrona Middle School and Torrance High.

For information on specific complexes and other helpful real estate and community details visit our Plaza Del Amo real estate blog site.

Most of the complexes are located east of Madrona, west of Crenshaw and just north of Sepulveda.  Some of the many complexes are:

Gated communities and complexes near Plaza Del Amo

Current Plaza Del Amo Torrance Homes for Sale


Real Estate Map of Plaza Del Amo

plaza del amo

Old Torrance Real Estate Trends

By Keith KyleTorrance Home Updates

As knowledge is critical in real estate, we hope that the information provided below will make the real estate market in Old Torrance easier to understand and the trends can make for educated decisions.  Whether you are a buyer, or a seller, knowing what the market is doing and where it appears to be heading can make all of the difference in the world.   If we can be of assistance in any way please don’t hesitate to contact us.  You can view these trends for all Torrance CA neighborhoods.

The chart below shows the recent history of the number of active listings, pending home sales and closed escrows.  The higher ratio of active to sold/pending listings shows a buyers market while lower inventory shows a sellers market.

The chart below shows the average price per square foot in Old Torrance.  This includes all types of homes including condos, townhomes and single family homes

The chart below shows the percentage of sold price / list price at which an equal number of properties are sold above, equal or below the list price and it indicates how long it has taken to sell those properties.

The chart below shows the difference between the average price for sale in Old Torrance and average price of the sold homes.  It helps determine whether the market is a buyer or seller market. If the average listing price and average sold price are the closest, the area has the healthiest market.

The chart below shows the months of inventory for a particular month.  As a rule of thumb, an inventory level of less than three indicates a strong seller market while an inventory level greater than six indicates a buyer’s market.

CONTACT US

for all of your Torrance real estate services

your torrance realtor

Torrance realtor Keith Kyle
Keith Kyle
Realtor

DRE#01712785

Vista Sotheby's logo

REALESTATETORRANCE – All rights reserved – Designed and Developed by Keith Kyle Homes