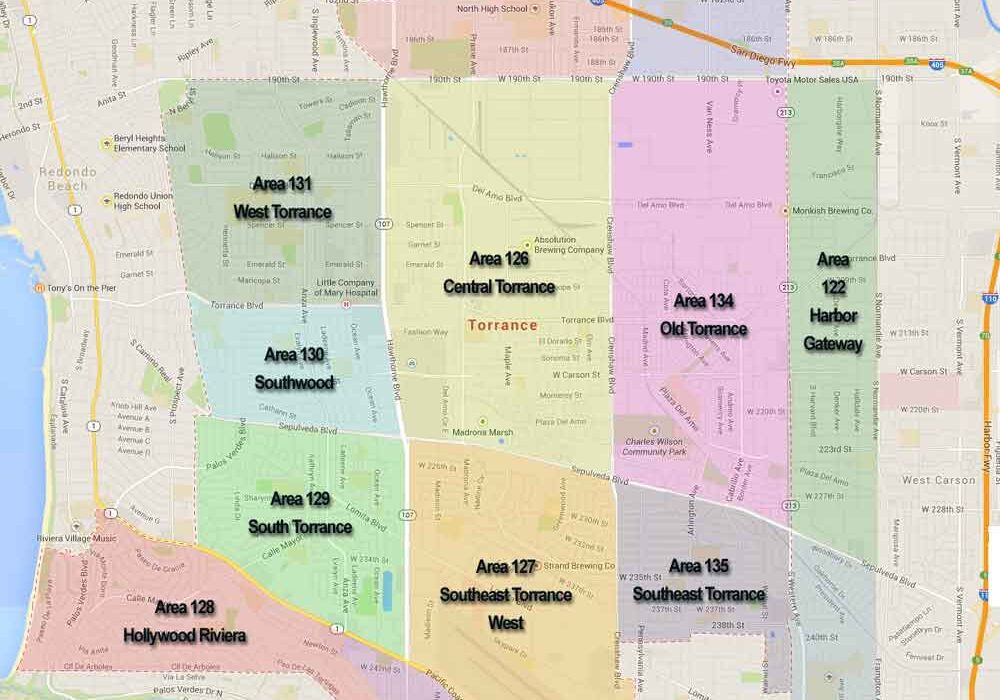
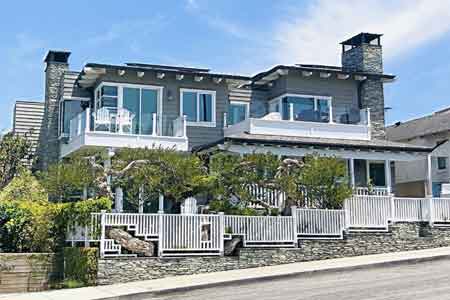
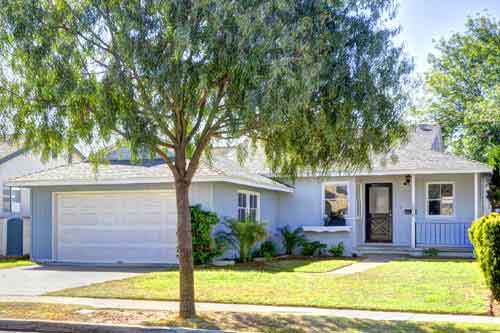
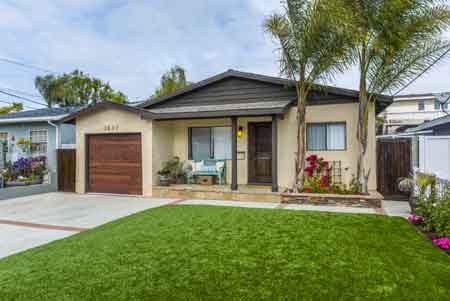
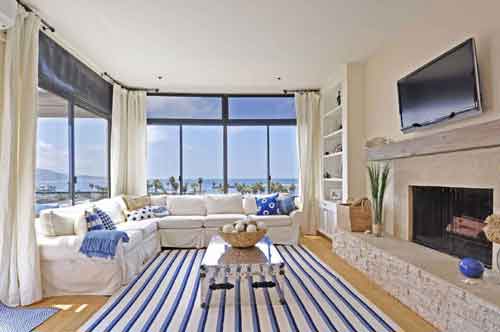
Torrance neighborhood real estate map.

Torrance CA Real Estate Map – Search for Homes

Welcome to our Torrance CA Real Estate Map and Home Search

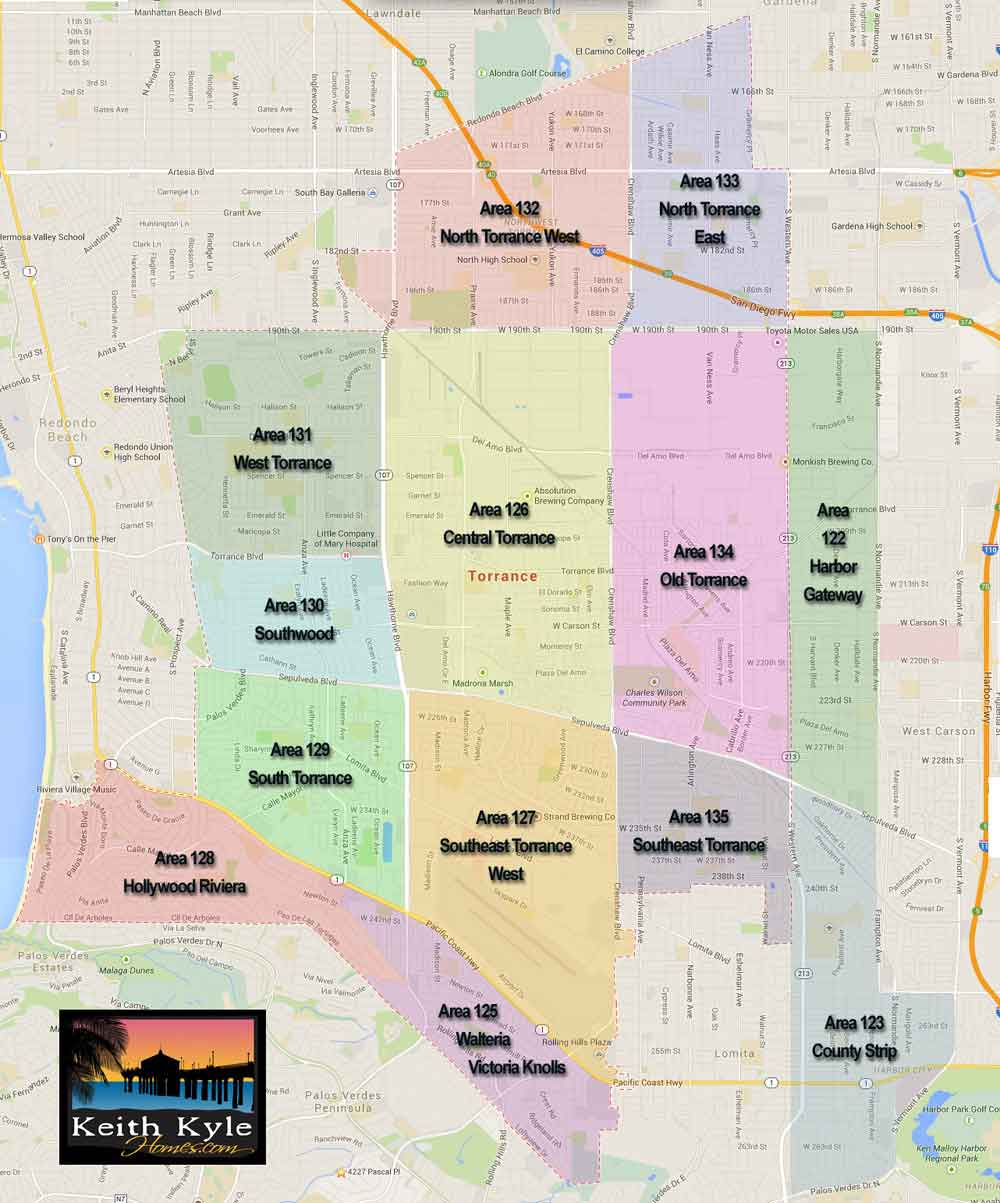
Torrance, California is a big city and it’s neighborhoods and areas vary considerably in the types of homes, feel of the neighborhood, and home prices.

As realtors, we search for homes by neighborhood so that we can best assist our clients to find the right type of homes in the right areas.  Below is a map used by realtors and used in MLS home searches.  The numbers coincide with the areas that we use to search and each has it’s differences and similarities.  The three areas that often cause confusion are area 128 the Hollywood Riviera and areas 122 and 123, Harbor Gateway and County Strip.

Much of the Hollywood Riviera actually has Redondo Beach, 90277, zip codes but the area is actually part of Torrance and services and schools are Torrance.  The County Strip and Harbor Gateway areas actually have Torrance zip codes but are serviced by the city of Los Angeles.  It’s distance from the beach, proximity to commercial and industrial, and the schools being LA Unified makes the homes significantly less expensive then the city of Torrance areas.

The Neighborhoods of Torrance CA
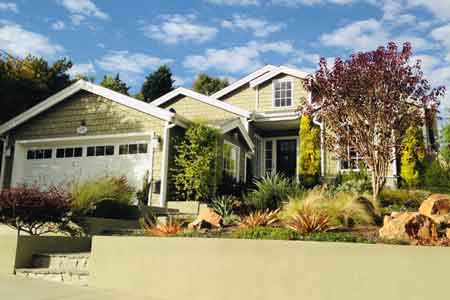
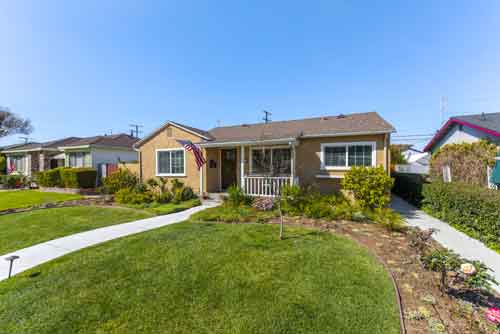
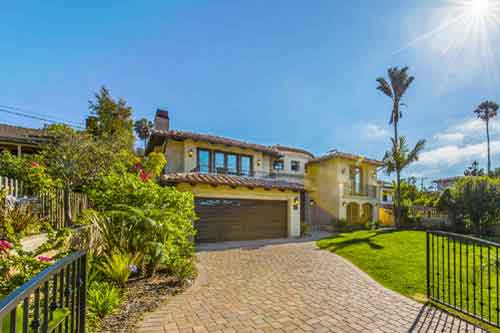
North Torrance homes West Torrance homes Hollywood Riviera homes Walteria Torrance homes Southwood Torrance homes OldTorrance South Torrance homes Southeast Torrance homes Central Torrance Harbor Gateway Torrance

Search Homes in Torrance Neighborhoods

torrancehomesforsale
westtorrancehomes
southwoodtorrance
plaza del amo
old torrance homes
walteria torrance
north torrance homes
torrancerealestate
torrancehomes
redondo beach real estate
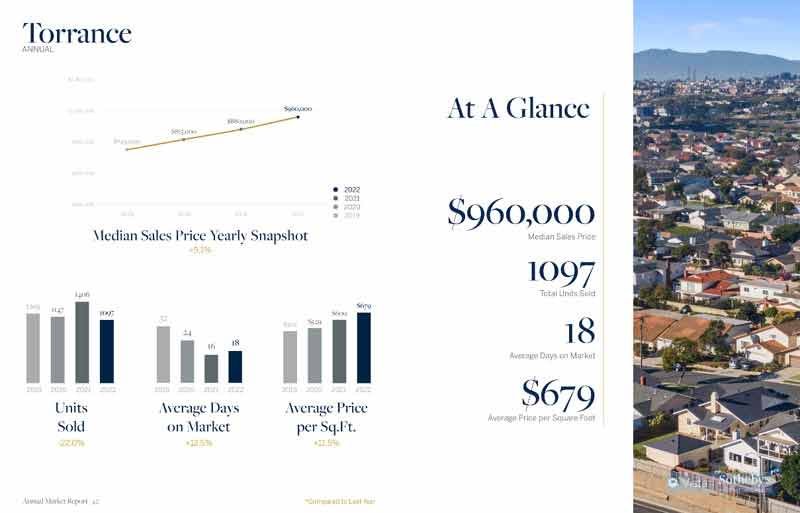
Torrance real estate 2022

Torrance Real Estate Market Trends

The market in Torrance has continued to be very favorable to sellers with the demand so high and the inventory still considerably low.  The past 3 months have seen a slight increase in inventory which may be temporary or may be showing signs that the very beginning of a more balanced market is on it’s way.  Keep in mind that Torrance is a big city and prices, demand, values, and trends can vary considerably throughout the city.  The chart below shows the number of active Torrance homes for sale (light green bar) the number of homes that went into escrow (red line) and the number of homes sold in that month (teal bar).  When the trend shows a monthly increase in homes for sale the market is heading towards a more balanced situation.  At the moment it is very much a sellers market.

For buyers, and especially first time buyers, the chart below is a helpful tool to determine what price to offer.  This is for all of Torrance and different neighborhoods vary, and certainly individual homes can be a different situation depending on what price is was listed at.  For the month of September selling prices were within 3% of the list prices.

What does this mean?

For buyers this generally means that “going in low” is probably not the right strategy.  Consult with your realtor as they should have a handle on what the value of the home should be and whether the asking price was set too high, or too low in the hopes of generating multiple offers and a potential bidding war.

Neighborhood Spotlight – Southwood

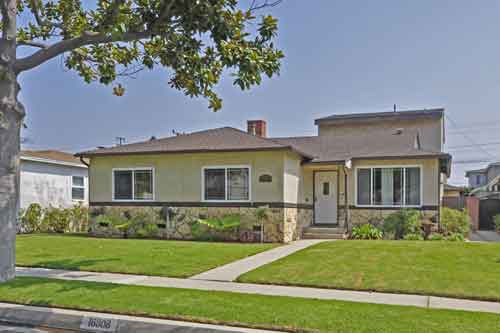
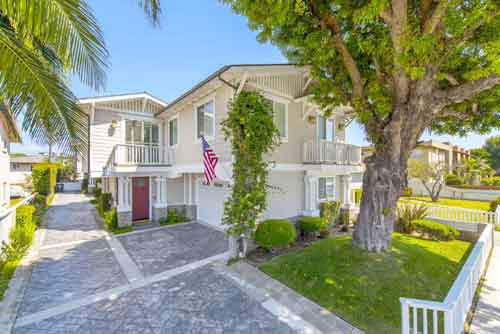
Sitting between West Torrance and South Torrance is the wonderful neighborhood of Southwood.  This small area also sits just east of Redondo Beach and the proximity to the ocean means milder weather and great Southwood Torrance Homesocean breezes that other parts of the city don’t enjoy.  Comprised mainly of 1940s and 1950s beach style bungalows, the area is still more affordable than some of the nearby beach cities while still having a certain charm lost in some of these other areas with oversized homes, makes a statement type architecture and over development.  Some homes have gone the route of maximum square footage, but the majority still look like homes that belong in the neighborhoods and give homeowners a bit of space and separation.  Although prices are still below neighboring South Redondo, they have risen dramatically in the past 2 years with most original smaller 3 bed/1 bath homes starting in the mid to low $600’s for fairly original, but nice condition, and the larger 3 bed/2 bath 1400 foot (many homes added a family room accounting for the extra square footage) selling anywhere from the mid to low $700s up to the low $900’s depending on location and condition.

What makes the area so special is the community feel, with an abundance of parks, dog parks and schools all within walking distance.   A quick drive down just about any street says it all with pride of ownership being quite apparent.  Manicured lawns, updated homes, tree lined streets and an abundance of neighbors walking the area makes for a great atmosphere.  Contact us if you are interested in learning more about Southwood or would be interested in receiving free email updates with the latest listings.

Current Southwood homes for sale

[idx-listings community=”Southwood” statuses=”1″ propertytypes=”516″ orderby=”DateAdded” orderdir=”DESC” count=”8″ showlargerphotos=”true”]

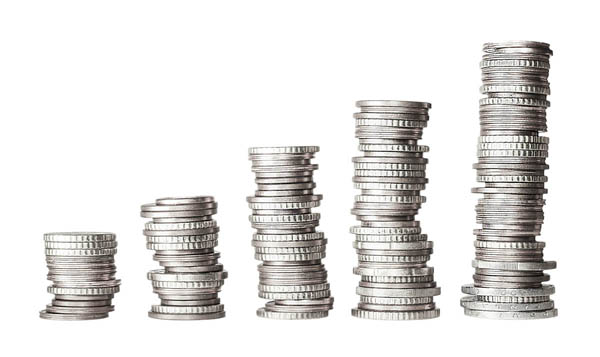
Coins in tabular chart

What Will Your Tax Savings Be By Owning a Home?

One of the more frequent questions lenders get when pre-approving a client for aCoins in tabular chart new home is “How much will this new home save me on my tax bill each month”? Many home buyers use the monthly tax savings to offset the increase in housing expense that a new home can bring. The savings can help the buyer to budget for a higher priced home which could make it possible to live in a more desirable neighborhood, possibly reap the benefits of higher property appreciation and help the buyer to have better resale options.

To help illustrate a home buyers potential monthly tax savings, the below chart shows the loan amount, monthly tax savings and how the monthly tax savings could be used to increase purchasing power.

Loan Amount Monthly Savings Increase in Purchase Power
$250,000 $297 $56,000
$300,000 $356 $67,000
$350,000 $416 $80,000
$400,000 $475 $94,000
$450,000 $534 $103,000
$500,000 $594 $113,000
$550,000 $653 $124,000
$600,000 $712 $137,000
$650,000 $772 $146,000

• Above based on mortgage interest rate of 4.75%, and a Federal Tax Brackett of 30.%
• Source: homes.yahoo.com – Figures to be verified with your CPA

Median home prices near $600,000 for August 2014

By Keith KyleNorth Torrance Homes

August was yet another big month for home prices in Torrance and the South Bay with  average home prices continuing to rise and the busy summer season continuing at a fairly torrid pace. Home sales were down from July due to the continuing lack of homes for sale.  Click any city and month below to see the full list of homes sold.  Contact us for more information on any of the homes.

August saw a total of 117 homes sold, down from 142 in July.  Of the 117 homes sold, 82 were single family homes, 16 were townhomes, and 17 were condos.  In addition there were 9 income properties (duplex, triplex, etc.) sold  as well as.  Of the 117 4 were short sales or foreclosures showing that the foreclosure market continues to dwindle and is a non factor in the current housing market.  The median home price was $600,000 up from $540,000 the prior month.

Townhomes for sale - 2209 Nelson

July 2014 Median Home Prices in Torrance CA

By Keith Kyle

Townhomes for sale - 2209 Nelson

July 2014 saw some big numbers in terms of both number of homes sold as well as median prices.  Torrance CA  had 142 sold homes at a median price of $540,000 which was down from the same month in 2013.  Most other South Bay cities also saw some significant year over year increases in prices with the other exceptions being  Marina Del Rey and Playa Del Rey.  To see the actual homes sales in each city visit our recent home sales price and information site.

City Homes Sold July 2014 Median July 2013 Median Year over Year % Change
Carson 48 $382,500 $350,000 9.29%
El Segundo 15 $872,000 $797,000 9.41%
Gardena 50 $385,000 $332,500 15.79%
Harbor City 13 $4 80,000 $465,000 3.23%
Hawthorne homes 51 $505,000 $400,000 26.25%
Hermosa Beach 26 $1,230,000 $1,097,500 12.07%
Lawndale 8 $412,000 $331,250 24.38%
Lomita 13 $555,000 $452,000 22.79%
Long Beach 330 $400,000 $365,000 9.59%
Manhattan Beach 43 $1,795,000 $1,521,250 18.00%
Marina Del Rey 33 $757,500 $862,500 -12.17%
Palos Verdes Estates 51 $1,600,000 $1,291,000 23.93%
Playa Del Rey 23 $507,000 $512,000 -0.98%
RanchoPalos Verdes 54 $1,069,000 $1,100,000 -2.82%
Redondo Beach 97 $865,000 $758,000 14.12%
San Pedro 49 $440,000 $420,500 4.64%
Torrance 142 $540,000 $576,250 -6.29%
Westchester 48 $777,500 $715,000 8.74%

CONTACT US

for all of your Torrance real estate services

your torrance realtor

Torrance realtor Keith Kyle
Keith Kyle
Realtor

DRE#01712785

Vista Sotheby's logo

REALESTATETORRANCE – All rights reserved – Designed and Developed by Keith Kyle Homes