
433 Paseo De La Playa – One of a Kind Home for Sale in the Hollywood Riviera
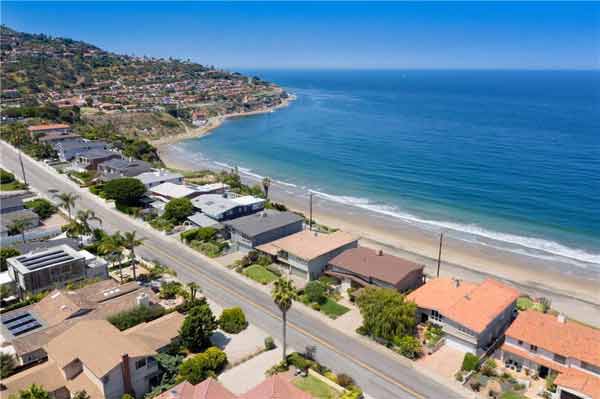
433 Paseo De La Playa is definitely one of a kind. Perched on the bluff with stunning ocean and coastline views, the 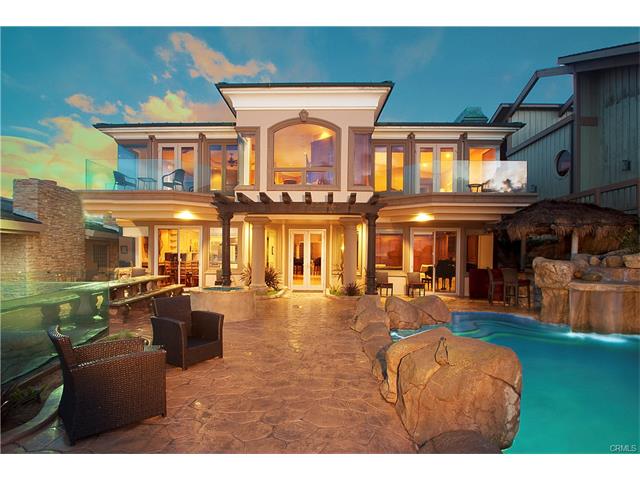 home is like something usually seen in Beverly Hills or Bel Aire….not Redondo Beach and Torrance.
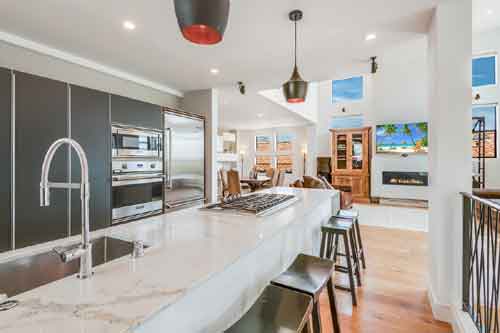
Boasting 7 bedrooms (all spacious), 6 1/2 baths, 7,792 square feet on a massive 25,000+ lot that extends to the beach this home has it all…..sports court, gated driveway, ocean view pool and spa (with a mini waterslide) and huge views from many of the rooms. The home even features a oversized path down to the sand which is rare as the California Coastal Commission highly regulates direct access to the beach and the permitting process (if approved) can take years and years.
The Hollywood Riviera is a fantastic neighborhood with a small town community charm, highly ranked schools and often times some great ocean views.
 2016
2016

 address below to view your nearest polling station.